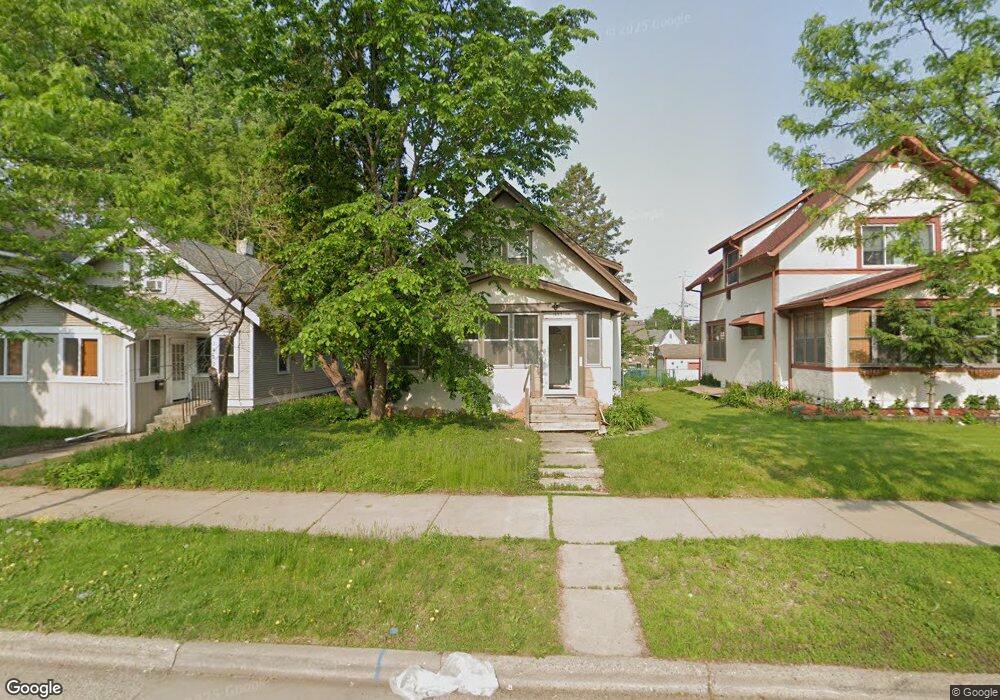
1427 Thomas Ave N Minneapolis, MN 55411
Willard-Hay NeighborhoodEstimated Value: $250,000 - $263,000
3
Beds
2
Baths
1,521
Sq Ft
$169/Sq Ft
Est. Value
About This Home
This home is located at 1427 Thomas Ave N, Minneapolis, MN 55411 and is currently estimated at $257,051, approximately $169 per square foot. 1427 Thomas Ave N is a home located in Hennepin County with nearby schools including Bryn Mawr Elementary School, Anwatin Middle School, and North High School.
Ownership History
Date
Name
Owned For
Owner Type
Purchase Details
Closed on
Dec 6, 2021
Sold by
Thomas Verlisha Orlean and Thomas Donavon Jerome
Bought by
Kronick Adrienne
Current Estimated Value
Home Financials for this Owner
Home Financials are based on the most recent Mortgage that was taken out on this home.
Original Mortgage
$206,374
Outstanding Balance
$189,759
Interest Rate
3.09%
Mortgage Type
FHA
Estimated Equity
$67,292
Purchase Details
Closed on
Mar 6, 2020
Sold by
Brwon Bernest and Brwon Angelique
Bought by
Thomas Verlisha Orlean and Thomas Donavon Jerome
Home Financials for this Owner
Home Financials are based on the most recent Mortgage that was taken out on this home.
Original Mortgage
$184,594
Interest Rate
3.4%
Mortgage Type
Stand Alone Second
Purchase Details
Closed on
Nov 30, 2000
Sold by
James Charlene Renee
Bought by
Brown Bernest and Brown Angelique
Create a Home Valuation Report for This Property
The Home Valuation Report is an in-depth analysis detailing your home's value as well as a comparison with similar homes in the area
Home Values in the Area
Average Home Value in this Area
Purchase History
| Date | Buyer | Sale Price | Title Company |
|---|---|---|---|
| Kronick Adrienne | $213,500 | Lendserv National Title Inc | |
| Thomas Verlisha Orlean | $188,000 | Titlesmart Inc | |
| Brown Bernest | $55,000 | -- |
Source: Public Records
Mortgage History
| Date | Status | Borrower | Loan Amount |
|---|---|---|---|
| Open | Kronick Adrienne | $206,374 | |
| Previous Owner | Thomas Verlisha Orlean | $184,594 | |
| Previous Owner | Thomas Verlisha Orlean | $184,594 |
Source: Public Records
Tax History Compared to Growth
Tax History
| Year | Tax Paid | Tax Assessment Tax Assessment Total Assessment is a certain percentage of the fair market value that is determined by local assessors to be the total taxable value of land and additions on the property. | Land | Improvement |
|---|---|---|---|---|
| 2024 | $3,684 | $234,000 | $21,000 | $213,000 |
| 2023 | $3,029 | $233,000 | $21,000 | $212,000 |
| 2022 | $2,139 | $205,000 | $16,000 | $189,000 |
| 2021 | $1,725 | $155,000 | $10,000 | $145,000 |
| 2020 | $1,902 | $129,500 | $14,700 | $114,800 |
| 2019 | $1,834 | $117,500 | $9,800 | $107,700 |
| 2018 | $1,788 | $107,000 | $9,800 | $97,200 |
| 2017 | $2,243 | $103,000 | $8,900 | $94,100 |
| 2016 | $1,860 | $93,500 | $8,900 | $84,600 |
| 2015 | $2,056 | $91,000 | $8,900 | $82,100 |
| 2014 | -- | $91,000 | $8,900 | $82,100 |
Source: Public Records
Map
Nearby Homes
- 1423 Upton Ave N
- 1411 Upton Ave N
- 1332 Upton Ave N
- 1642 Thomas Ave N
- 2600 Plymouth Ave N Unit A
- 1336 Russell Ave N
- 1400 Queen Ave N
- 1423 Penn Ave N
- 1519 Oliver Ave N
- 2604 Golden Valley Rd
- 1722 Queen Ave N
- 2817 Golden Valley Rd
- 1800 Penn Ave N
- 1214 Penn Ave N
- 1429 Morgan Ave N
- 2007 Queen Ave N
- 1623 Morgan Ave N
- 1819 Newton Ave N
- 1501 Logan Ave N
- 1519 Logan Ave N
- 1501 Thomas Ave N
- 1423 Thomas Ave N
- 1419 Thomas Ave N
- 1507 Thomas Ave N
- 1511 Thomas Ave N
- 1415 Thomas Ave N
- 1426 Upton Ave N
- 1422 Upton Ave N
- 1515 Thomas Ave N
- 1411 Thomas Ave N
- 1418 Upton Ave N
- 1506 Upton Ave N
- 1414 Upton Ave N
- 1510 Upton Ave N
- 1426 Thomas Ave N
- 1502 Thomas Ave N
- 1422 Thomas Ave N
- 1407 Thomas Ave N
- 1506 Thomas Ave N
- 1418 Thomas Ave N