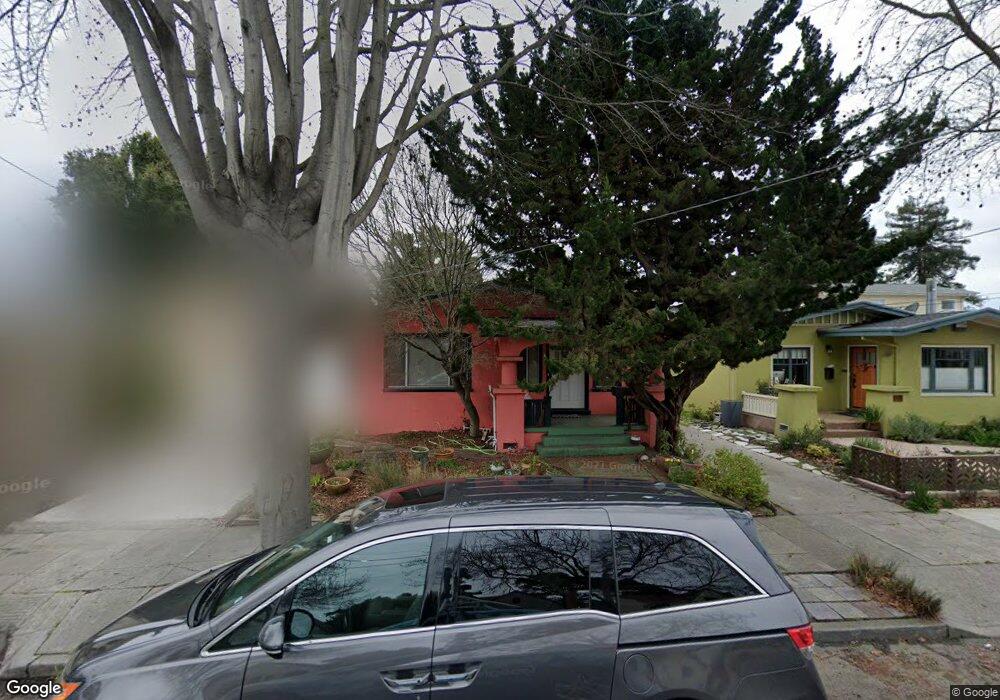
1428 Blake St Berkeley, CA 94702
West Berkeley NeighborhoodEstimated Value: $719,000 - $1,465,000
2
Beds
1
Bath
1,120
Sq Ft
$939/Sq Ft
Est. Value
About This Home
This home is located at 1428 Blake St, Berkeley, CA 94702 and is currently estimated at $1,052,224, approximately $939 per square foot. 1428 Blake St is a home located in Alameda County with nearby schools including Washington Elementary School, Malcolm X Elementary School, and Oxford Elementary School.
Ownership History
Date
Name
Owned For
Owner Type
Purchase Details
Closed on
Nov 12, 2002
Sold by
Furuto Setsuko
Bought by
Parkyn Barbara J and Yamauchi Robert O
Current Estimated Value
Home Financials for this Owner
Home Financials are based on the most recent Mortgage that was taken out on this home.
Original Mortgage
$224,000
Outstanding Balance
$95,617
Interest Rate
6.28%
Estimated Equity
$956,607
Create a Home Valuation Report for This Property
The Home Valuation Report is an in-depth analysis detailing your home's value as well as a comparison with similar homes in the area
Home Values in the Area
Average Home Value in this Area
Purchase History
| Date | Buyer | Sale Price | Title Company |
|---|---|---|---|
| Parkyn Barbara J | $280,000 | First California Title Co |
Source: Public Records
Mortgage History
| Date | Status | Borrower | Loan Amount |
|---|---|---|---|
| Open | Parkyn Barbara J | $224,000 |
Source: Public Records
Tax History
| Year | Tax Paid | Tax Assessment Tax Assessment Total Assessment is a certain percentage of the fair market value that is determined by local assessors to be the total taxable value of land and additions on the property. | Land | Improvement |
|---|---|---|---|---|
| 2025 | $7,163 | $398,495 | $121,648 | $283,847 |
| 2024 | $7,163 | $390,546 | $119,264 | $278,282 |
| 2023 | $6,998 | $389,754 | $116,926 | $272,828 |
| 2022 | $6,846 | $375,112 | $114,633 | $267,479 |
| 2021 | $6,841 | $367,622 | $112,386 | $262,236 |
| 2020 | $6,433 | $370,784 | $111,235 | $259,549 |
| 2019 | $6,130 | $363,514 | $109,054 | $254,460 |
| 2018 | $6,010 | $356,388 | $106,916 | $249,472 |
| 2017 | $5,776 | $349,403 | $104,821 | $244,582 |
| 2016 | $5,553 | $342,554 | $102,766 | $239,788 |
| 2015 | $5,471 | $337,410 | $101,223 | $236,187 |
| 2014 | $5,369 | $330,802 | $99,240 | $231,562 |
Source: Public Records
Map
Nearby Homes
- 2350 Sacramento St
- 1515 Derby St
- 1612 Parker St
- 1612 Carleton St
- 2750 Sacramento St
- 1450 Ward St
- 1645 Dwight Way
- 2758 Sacramento St
- 2774 Sacramento St
- 2782 Sacramento St
- 2790 Sacramento St
- 1142 Dwight Way
- 1118 Dwight Way
- 2324 Browning St
- 1530 Stuart St
- 2727 McGee Ave
- 1578 Allston Way
- 1092 Dwight Way
- 2751 Wallace St
- 2701 Grant St
Your Personal Tour Guide
Ask me questions while you tour the home.