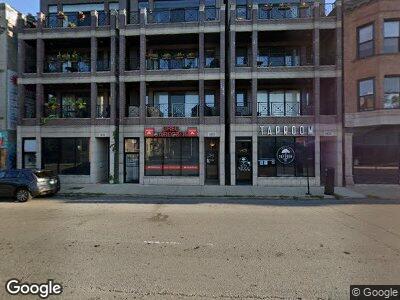
1428 W Irving Park Rd Unit 2 Chicago, IL 60613
West Graceland NeighborhoodEstimated Value: $611,000 - $724,000
3
Beds
2
Baths
7,285
Sq Ft
$89/Sq Ft
Est. Value
About This Home
This home is located at 1428 W Irving Park Rd Unit 2, Chicago, IL 60613 and is currently estimated at $647,834, approximately $88 per square foot. 1428 W Irving Park Rd Unit 2 is a home located in Cook County with nearby schools including Blaine Elementary School, Lake View High School, and German International School Chicago.
Ownership History
Date
Name
Owned For
Owner Type
Purchase Details
Closed on
Feb 24, 2017
Sold by
Kahn Matthew S and Kahn Sara L
Bought by
Livin Kahn Matthew S and Matthew S Kahn Revocable Living Trust
Current Estimated Value
Purchase Details
Closed on
Aug 22, 2011
Sold by
Ferguson Brian P and Ferguson Melinda
Bought by
Kahn Matthew S and Kahn Sara L
Home Financials for this Owner
Home Financials are based on the most recent Mortgage that was taken out on this home.
Original Mortgage
$296,000
Interest Rate
4.59%
Mortgage Type
New Conventional
Purchase Details
Closed on
Oct 15, 2007
Sold by
1430 West Irving Ii Llc
Bought by
Ferguson Brian P and Ferguson Melinda
Home Financials for this Owner
Home Financials are based on the most recent Mortgage that was taken out on this home.
Original Mortgage
$50,000
Interest Rate
8.2%
Mortgage Type
Stand Alone Second
Create a Home Valuation Report for This Property
The Home Valuation Report is an in-depth analysis detailing your home's value as well as a comparison with similar homes in the area
Home Values in the Area
Average Home Value in this Area
Purchase History
| Date | Buyer | Sale Price | Title Company |
|---|---|---|---|
| Livin Kahn Matthew S | -- | Precision Title | |
| Kahn Matthew S | $370,000 | Cti | |
| Ferguson Brian P | $479,000 | Cti |
Source: Public Records
Mortgage History
| Date | Status | Borrower | Loan Amount |
|---|---|---|---|
| Open | Kahn Matthew S | $242,000 | |
| Closed | Kahn Matthew S | $292,000 | |
| Closed | Kahn Matthew S | $296,000 | |
| Previous Owner | Ferguson Brian P | $376,000 | |
| Previous Owner | Ferguson Brian P | $50,000 |
Source: Public Records
Tax History Compared to Growth
Tax History
| Year | Tax Paid | Tax Assessment Tax Assessment Total Assessment is a certain percentage of the fair market value that is determined by local assessors to be the total taxable value of land and additions on the property. | Land | Improvement |
|---|---|---|---|---|
| 2024 | $9,580 | $55,466 | $11,532 | $43,934 |
| 2023 | $9,580 | $50,000 | $9,308 | $40,692 |
| 2022 | $9,580 | $50,000 | $9,308 | $40,692 |
| 2021 | $9,384 | $49,998 | $9,307 | $40,691 |
| 2020 | $8,295 | $40,336 | $5,998 | $34,338 |
| 2019 | $8,130 | $43,896 | $5,998 | $37,898 |
| 2018 | $7,992 | $43,896 | $5,998 | $37,898 |
| 2017 | $8,534 | $43,019 | $5,171 | $37,848 |
| 2016 | $8,116 | $43,019 | $5,171 | $37,848 |
| 2015 | $7,402 | $43,019 | $5,171 | $37,848 |
| 2014 | $5,992 | $34,861 | $1,344 | $33,517 |
| 2013 | $6,340 | $34,861 | $1,344 | $33,517 |
Source: Public Records
Map
Nearby Homes
- 1426 W Irving Park Rd Unit 4
- 1444 W Cuyler Ave
- 1442 W Cuyler Ave
- 3930 N Southport Ave Unit 2S
- 4051 N Southport Ave Unit 1
- 1414 W Byron St Unit 3W
- 3951 N Wayne Ave Unit 405
- 3951 N Wayne Ave Unit 305
- 3951 N Wayne Ave Unit 205
- 3951 N Wayne Ave Unit 409
- 3951 N Wayne Ave Unit 301
- 3951 N Wayne Ave Unit 207
- 3951 N Wayne Ave Unit 404
- 3951 N Wayne Ave Unit 107
- 3930 N Greenview Ave Unit 2
- 1350 W Byron St Unit 9
- 3926 N Greenview Ave
- 1427 W Warner Ave Unit 1E
- 3923 N Ashland Ave Unit 201
- 1462 W Warner Ave
- 1428 W Irving Park Rd
- 1428 W Irving Park Rd Unit 3
- 1428 W Irving Park Rd Unit 2
- 1428 W Irving Park Rd Unit 4
- 1430 W Irving Park Rd Unit 4
- 1430 W Irving Park Rd Unit 3
- 1430 W Irving Park Rd Unit 1
- 1426 W Irving Park Rd Unit 3
- 1426 W Irving Park Rd Unit 2
- 1422 W Irving Park Rd Unit 3
- 1432 W Irving Park Rd Unit 3F
- 1432 W Irving Park Rd Unit 1R
- 1432 W Irving Park Rd Unit 3R
- 1432 W Irving Park Rd Unit 2R
- 1432 W Irving Park Rd
- 1432 W Irving Park
- 1420 W Irving Park Rd
- 1420 W Irving Park Rd Unit 3
- 1420 W Irving Park Rd Unit 2
- 1434 W Irving Park Rd