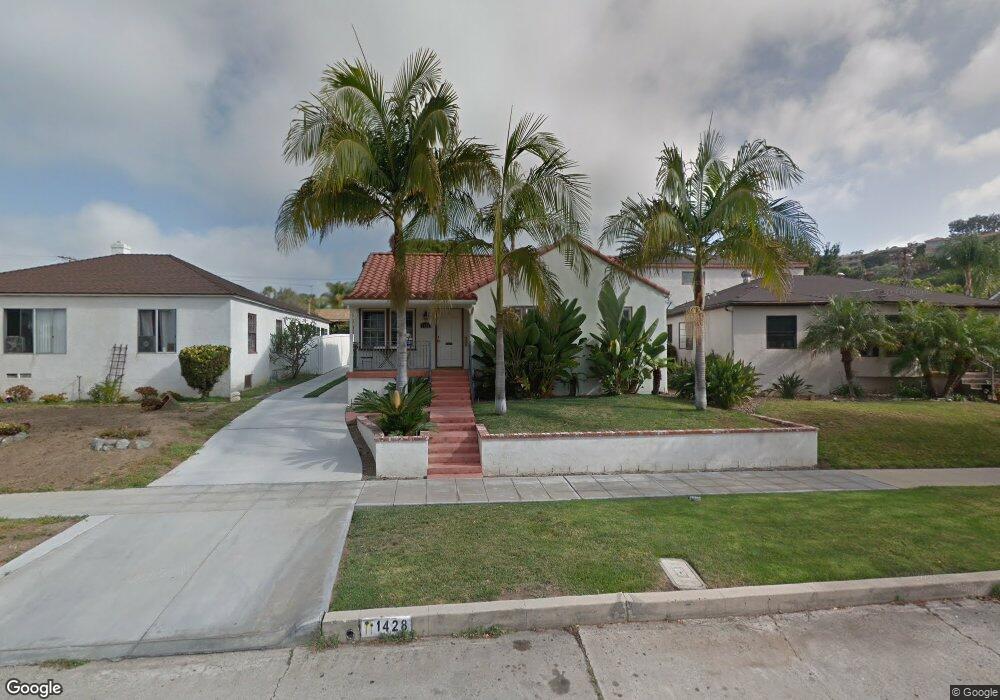
1428 Wilbur Ave San Diego, CA 92109
Pacific Beach NeighborhoodEstimated Value: $1,815,057 - $2,006,000
3
Beds
2
Baths
1,317
Sq Ft
$1,456/Sq Ft
Est. Value
About This Home
This home is located at 1428 Wilbur Ave, San Diego, CA 92109 and is currently estimated at $1,918,014, approximately $1,456 per square foot. 1428 Wilbur Ave is a home located in San Diego County with nearby schools including Pacific Beach Elementary School, Pacific Beach Middle, and Mission Bay High School.
Ownership History
Date
Name
Owned For
Owner Type
Purchase Details
Closed on
Apr 4, 2016
Sold by
Mattingly Thomas Hamilton
Bought by
Mattingly Thomas H and Mattingly Denise A
Current Estimated Value
Home Financials for this Owner
Home Financials are based on the most recent Mortgage that was taken out on this home.
Original Mortgage
$49,250
Outstanding Balance
$39,104
Interest Rate
3.58%
Mortgage Type
Credit Line Revolving
Estimated Equity
$1,878,910
Purchase Details
Closed on
Jul 2, 2004
Sold by
Koller Rachel
Bought by
Mattingly Thomas Hamilton
Home Financials for this Owner
Home Financials are based on the most recent Mortgage that was taken out on this home.
Original Mortgage
$575,350
Interest Rate
5.37%
Mortgage Type
New Conventional
Purchase Details
Closed on
Nov 13, 2002
Sold by
Beitinger Kathleen K
Bought by
Beitinger Kathleen K
Purchase Details
Closed on
Dec 8, 1993
Sold by
Lambrecht Edward L and Lambrecht Mary K
Bought by
Lambrecht Edward L and Lambrecht Mary K
Create a Home Valuation Report for This Property
The Home Valuation Report is an in-depth analysis detailing your home's value as well as a comparison with similar homes in the area
Home Values in the Area
Average Home Value in this Area
Purchase History
| Date | Buyer | Sale Price | Title Company |
|---|---|---|---|
| Mattingly Thomas H | -- | Corinthian Title Company | |
| Mattingly Thomas Hamilton | $719,500 | Lawyers Title | |
| Beitinger Kathleen K | -- | -- | |
| Lambrecht Edward L | -- | -- | |
| Lambrecht Edward L | -- | -- | |
| Lambrecht Edward L | -- | -- | |
| Lambrecht Edward L | -- | -- | |
| Lambrecht Edward L | -- | -- | |
| Lambrecht Edward L | -- | -- | |
| Lambrecht Edward L | -- | -- | |
| Lambrecht Edward L | -- | -- |
Source: Public Records
Mortgage History
| Date | Status | Borrower | Loan Amount |
|---|---|---|---|
| Open | Mattingly Thomas H | $49,250 | |
| Open | Mattingly Thomas H | $622,000 | |
| Closed | Mattingly Thomas Hamilton | $575,350 |
Source: Public Records
Tax History Compared to Growth
Tax History
| Year | Tax Paid | Tax Assessment Tax Assessment Total Assessment is a certain percentage of the fair market value that is determined by local assessors to be the total taxable value of land and additions on the property. | Land | Improvement |
|---|---|---|---|---|
| 2025 | $12,325 | $1,025,720 | $801,493 | $224,227 |
| 2024 | $12,325 | $1,005,609 | $785,778 | $219,831 |
| 2023 | $12,050 | $985,892 | $770,371 | $215,521 |
| 2022 | $11,728 | $966,562 | $755,266 | $211,296 |
| 2021 | $11,645 | $947,610 | $740,457 | $207,153 |
| 2020 | $11,502 | $937,894 | $732,865 | $205,029 |
| 2019 | $11,296 | $919,505 | $718,496 | $201,009 |
| 2018 | $10,560 | $901,476 | $704,408 | $197,068 |
| 2017 | $80 | $883,801 | $690,597 | $193,204 |
| 2016 | $10,142 | $866,472 | $677,056 | $189,416 |
| 2015 | $9,991 | $853,457 | $666,886 | $186,571 |
| 2014 | $8,809 | $750,000 | $657,000 | $93,000 |
Source: Public Records
Map
Nearby Homes
- 1505 Loring St
- 1712 Beryl St
- 1737 Beryl St
- 5209 Foothill Blvd
- 4733 Ingraham St
- 4964 Kendall St
- 1645 Los Altos Rd
- 1154 Sapphire St
- 5108 Gordon Ln
- 1270 Emerald St
- 1148 Turquoise St
- 1025 Wilbur Ave
- 1220 Emerald St
- 1361 Felspar St Unit 7
- 4944 Cass St Unit 604
- 4944 Cass St Unit 407
- 4804 Lamont St
- 1818 Diamond St
- 1816 Diamond St
- 1059 Agate St Unit A
- 1422 Wilbur Ave
- 1434 Wilbur Ave
- 1416 Wilbur Ave
- 1440 Wilbur Ave
- 1435 Loring St
- 1427 Loring St
- 1445 Loring St
- 1408 Wilbur Ave
- 1419 Loring St
- 1453 Loring St
- 1446 Wilbur Ave
- 1411 Loring St
- 1459 Loring St
- 1427 Wilbur Ave
- 1435 Wilbur Ave
- 1421 Wilbur Ave
- 1415 Wilbur Ave
- 1403 Loring St
- 1454 Wilbur Ave
- 1453 Wilbur Ave