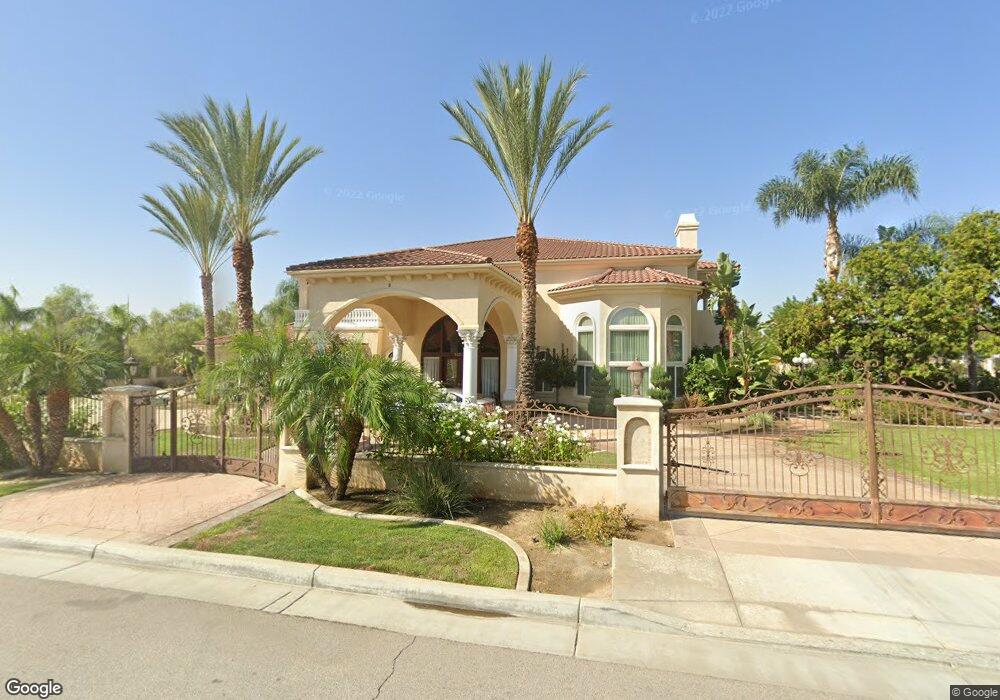
14287 Merlot Ct Riverside, CA 92508
Alessandro Heights NeighborhoodEstimated Value: $2,415,143 - $3,308,000
6
Beds
5
Baths
8,923
Sq Ft
$316/Sq Ft
Est. Value
About This Home
This home is located at 14287 Merlot Ct, Riverside, CA 92508 and is currently estimated at $2,822,536, approximately $316 per square foot. 14287 Merlot Ct is a home located in Riverside County with nearby schools including John F. Kennedy Elementary School, Amelia Earhart Middle School, and Martin Luther King Junior High School.
Ownership History
Date
Name
Owned For
Owner Type
Purchase Details
Closed on
May 25, 2021
Sold by
Dixit Sudhakar
Bought by
Dixit Sudhakar and Dixit Sandhya
Current Estimated Value
Home Financials for this Owner
Home Financials are based on the most recent Mortgage that was taken out on this home.
Original Mortgage
$1,534,500
Outstanding Balance
$1,388,466
Interest Rate
3%
Mortgage Type
VA
Estimated Equity
$1,434,070
Purchase Details
Closed on
Jul 23, 2007
Sold by
Dixit Sandhya
Bought by
Dixit Sudhakar
Home Financials for this Owner
Home Financials are based on the most recent Mortgage that was taken out on this home.
Original Mortgage
$1,600,000
Interest Rate
8.25%
Mortgage Type
Construction
Purchase Details
Closed on
Jul 18, 2005
Sold by
Mdm Llc
Bought by
Dixit Sudbakar and Dixit Sandhya
Home Financials for this Owner
Home Financials are based on the most recent Mortgage that was taken out on this home.
Original Mortgage
$327,250
Interest Rate
5.64%
Mortgage Type
Balloon
Create a Home Valuation Report for This Property
The Home Valuation Report is an in-depth analysis detailing your home's value as well as a comparison with similar homes in the area
Home Values in the Area
Average Home Value in this Area
Purchase History
| Date | Buyer | Sale Price | Title Company |
|---|---|---|---|
| Dixit Sudhakar | -- | Ticor Title Company | |
| Dixit Sudhakar | -- | Stewart Title Of California | |
| Dixit Sudbakar | $385,000 | First American Title Company |
Source: Public Records
Mortgage History
| Date | Status | Borrower | Loan Amount |
|---|---|---|---|
| Open | Dixit Sudhakar | $1,534,500 | |
| Closed | Dixit Sudhakar | $1,600,000 | |
| Closed | Dixit Sudbakar | $327,250 |
Source: Public Records
Tax History Compared to Growth
Tax History
| Year | Tax Paid | Tax Assessment Tax Assessment Total Assessment is a certain percentage of the fair market value that is determined by local assessors to be the total taxable value of land and additions on the property. | Land | Improvement |
|---|---|---|---|---|
| 2025 | $23,244 | $2,161,227 | $526,121 | $1,635,106 |
| 2023 | $23,244 | $2,077,306 | $505,692 | $1,571,614 |
| 2022 | $22,767 | $2,036,576 | $495,777 | $1,540,799 |
| 2021 | $22,397 | $1,996,644 | $486,057 | $1,510,587 |
| 2020 | $22,227 | $1,976,172 | $481,074 | $1,495,098 |
| 2019 | $21,806 | $1,937,425 | $471,642 | $1,465,783 |
| 2018 | $21,378 | $1,899,438 | $462,395 | $1,437,043 |
| 2017 | $20,996 | $1,862,195 | $453,329 | $1,408,866 |
| 2016 | $19,631 | $1,825,683 | $444,441 | $1,381,242 |
| 2015 | $19,356 | $1,798,262 | $437,766 | $1,360,496 |
| 2014 | $19,179 | $1,763,039 | $429,192 | $1,333,847 |
Source: Public Records
Map
Nearby Homes
- 14392 Merlot Ct
- 18805 Moss Rd
- 7390 Corinthian Way
- 7429 Selena St
- 1257 Fetlock Way
- 7047 Golden Vale Dr
- 7007 Golden Vale Dr
- 1126 Brasado Way
- 7619 Hillhurst Dr
- 7639 Hillhurst Dr
- 1137 Pamplona Dr
- 19121 Broken Bow Dr
- 14787 Wood Rd
- 19155 Vintage Woods Dr
- 338 Eternal Way
- 1249 Coronet Dr
- 19138 Kangnam Rd
- 7282 Magnon Ct
- 6978 Withers Rd
- 7250 Goldboro Ln