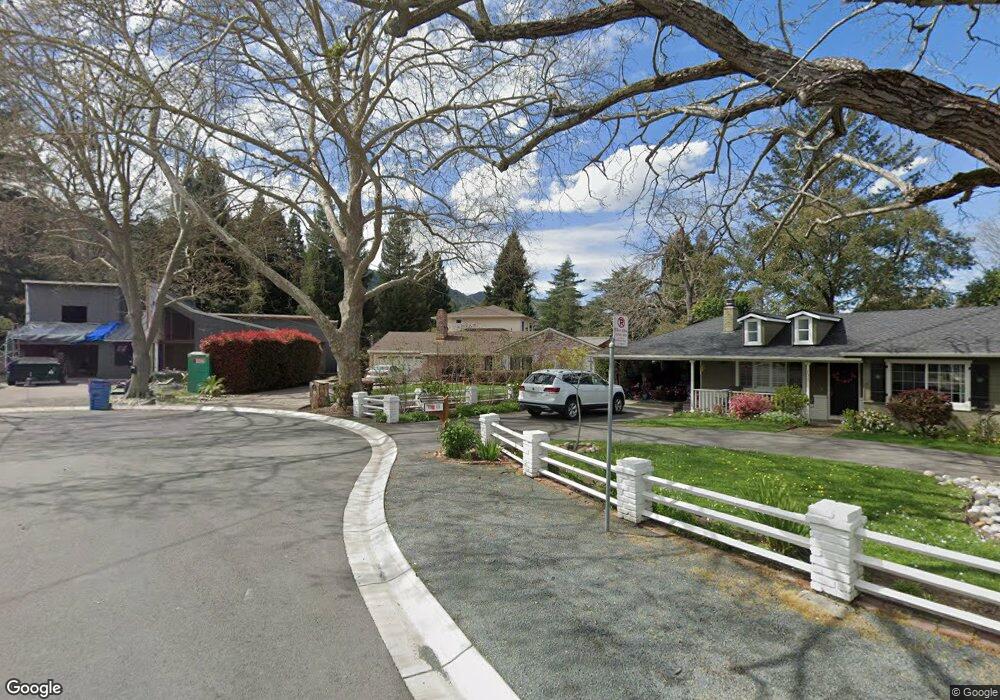
143 Alice Ct Danville, CA 94526
Downtown Danville NeighborhoodEstimated Value: $2,503,679 - $2,676,000
4
Beds
2
Baths
2,057
Sq Ft
$1,257/Sq Ft
Est. Value
About This Home
This home is located at 143 Alice Ct, Danville, CA 94526 and is currently estimated at $2,586,670, approximately $1,257 per square foot. 143 Alice Ct is a home located in Contra Costa County with nearby schools including Montair Elementary School, Stone Valley Middle School, and San Ramon Valley High School.
Ownership History
Date
Name
Owned For
Owner Type
Purchase Details
Closed on
Mar 4, 2021
Sold by
Wood Scott E and Wood Laurie H
Bought by
Strong Riley M and Parker Eryn D
Current Estimated Value
Purchase Details
Closed on
Jun 20, 2013
Sold by
Wood Scott E and Wood Laurie H
Bought by
Wood Scott E and Wood Laurie H
Purchase Details
Closed on
Aug 11, 1997
Sold by
Wood Albert H and Wood Alma M
Bought by
Wood Scott E and Wood Laurie H
Home Financials for this Owner
Home Financials are based on the most recent Mortgage that was taken out on this home.
Original Mortgage
$272,000
Interest Rate
7.25%
Mortgage Type
Purchase Money Mortgage
Purchase Details
Closed on
May 30, 1995
Sold by
Wood Albert H and Wood Alma M
Bought by
Wood Albert H and Wood Alma M
Create a Home Valuation Report for This Property
The Home Valuation Report is an in-depth analysis detailing your home's value as well as a comparison with similar homes in the area
Home Values in the Area
Average Home Value in this Area
Purchase History
| Date | Buyer | Sale Price | Title Company |
|---|---|---|---|
| Strong Riley M | $2,150,000 | Old Republic Title Company | |
| Wood Scott E | -- | None Available | |
| Wood Scott E | $340,000 | Old Republic Title Company | |
| Wood Albert H | -- | -- |
Source: Public Records
Mortgage History
| Date | Status | Borrower | Loan Amount |
|---|---|---|---|
| Previous Owner | Wood Scott E | $272,000 | |
| Closed | Wood Scott E | $34,000 |
Source: Public Records
Tax History
| Year | Tax Paid | Tax Assessment Tax Assessment Total Assessment is a certain percentage of the fair market value that is determined by local assessors to be the total taxable value of land and additions on the property. | Land | Improvement |
|---|---|---|---|---|
| 2025 | $26,433 | $2,327,228 | $1,623,648 | $703,580 |
| 2024 | $25,403 | $2,281,597 | $1,591,812 | $689,785 |
| 2023 | $25,403 | $2,236,860 | $1,560,600 | $676,260 |
| 2022 | $25,217 | $2,193,000 | $1,530,000 | $663,000 |
| 2021 | $3,255 | $209,509 | $31,182 | $178,327 |
| 2019 | $3,154 | $203,297 | $30,258 | $173,039 |
| 2018 | $3,040 | $199,312 | $29,665 | $169,647 |
| 2017 | $2,926 | $195,405 | $29,084 | $166,321 |
| 2016 | $2,867 | $191,574 | $28,514 | $163,060 |
| 2015 | $2,813 | $188,697 | $28,086 | $160,611 |
| 2014 | $2,758 | $185,001 | $27,536 | $157,465 |
Source: Public Records
Map
Nearby Homes
- 70 Railroad Ave
- 57 Danville Oak Place Unit 57
- 35 Danville Oak Place
- 165 Rubicon Cir Unit 17
- 428 Marian Ln
- 550 W El Pintado
- 315 Garden Creek Place
- 375 W El Pintado Unit 202
- 375 W El Pintado Unit 204
- 375 W El Pintado Unit 227
- 375 W El Pintado Unit 221
- 375 W El Pintado Unit 323
- 375 W El Pintado Unit 201
- 375 W El Pintado Unit 105
- 375 W El Pintado Unit 207
- 375 W El Pintado Unit 218
- 348 Del Amigo Rd
- 5 Sky Terrace
- 600 Hartz Ave Unit 201
- 600 Hartz Ave Unit 114
Your Personal Tour Guide
Ask me questions while you tour the home.