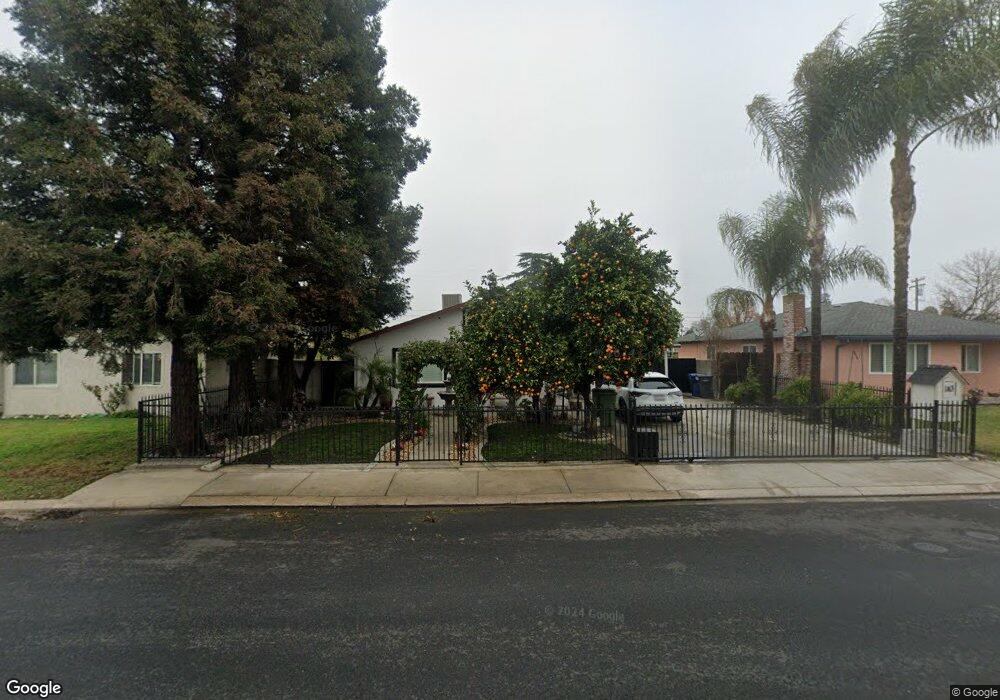
143 Hedstrom Rd Turlock, CA 95382
Estimated Value: $344,000 - $443,000
3
Beds
2
Baths
1,104
Sq Ft
$361/Sq Ft
Est. Value
About This Home
This home is located at 143 Hedstrom Rd, Turlock, CA 95382 and is currently estimated at $398,026, approximately $360 per square foot. 143 Hedstrom Rd is a home located in Stanislaus County with nearby schools including Crowell Elementary School, Marvin A. Dutcher Middle School, and Turlock Junior High School.
Ownership History
Date
Name
Owned For
Owner Type
Purchase Details
Closed on
Jan 18, 2024
Sold by
Alvarez Maricela
Bought by
Murguia Family Trust and Alvarez
Current Estimated Value
Purchase Details
Closed on
Apr 17, 2015
Sold by
Alvarez Antonio and Alvarez Maricela
Bought by
Alvarez Maricela
Purchase Details
Closed on
Mar 15, 1999
Sold by
Bravo Armando and Bravo Lorena
Bought by
Alvarez Antonio and Alvarez Maricela
Home Financials for this Owner
Home Financials are based on the most recent Mortgage that was taken out on this home.
Original Mortgage
$61,350
Interest Rate
6.98%
Mortgage Type
FHA
Purchase Details
Closed on
Jul 12, 1995
Sold by
Ables Carol O and Sexton Carol O
Bought by
Bravo Armando and Bravo Lorena
Home Financials for this Owner
Home Financials are based on the most recent Mortgage that was taken out on this home.
Original Mortgage
$79,039
Interest Rate
7.97%
Mortgage Type
FHA
Create a Home Valuation Report for This Property
The Home Valuation Report is an in-depth analysis detailing your home's value as well as a comparison with similar homes in the area
Purchase History
| Date | Buyer | Sale Price | Title Company |
|---|---|---|---|
| Murguia Family Trust | -- | None Listed On Document | |
| Alvarez Maricela | -- | None Available | |
| Alvarez Antonio | $80,000 | North American Title Co | |
| Bravo Armando | $79,000 | North American Title |
Source: Public Records
Mortgage History
| Date | Status | Borrower | Loan Amount |
|---|---|---|---|
| Previous Owner | Alvarez Antonio | $61,350 | |
| Previous Owner | Bravo Armando | $79,039 |
Source: Public Records
Tax History
| Year | Tax Paid | Tax Assessment Tax Assessment Total Assessment is a certain percentage of the fair market value that is determined by local assessors to be the total taxable value of land and additions on the property. | Land | Improvement |
|---|---|---|---|---|
| 2025 | $1,376 | $134,962 | $47,022 | $87,940 |
| 2024 | $1,349 | $132,316 | $46,100 | $86,216 |
| 2023 | $1,345 | $129,723 | $45,197 | $84,526 |
| 2022 | $1,327 | $127,180 | $44,311 | $82,869 |
| 2021 | $1,301 | $124,688 | $43,443 | $81,245 |
| 2020 | $1,296 | $123,410 | $42,998 | $80,412 |
| 2019 | $1,273 | $120,991 | $42,155 | $78,836 |
| 2018 | $1,270 | $118,620 | $41,329 | $77,291 |
| 2017 | $1,239 | $116,295 | $40,519 | $75,776 |
| 2016 | $1,171 | $114,016 | $39,725 | $74,291 |
| 2015 | $1,220 | $112,305 | $39,129 | $73,176 |
| 2014 | $1,208 | $110,106 | $38,363 | $71,743 |
Source: Public Records
Map
Nearby Homes
- 125 Hedstrom Rd
- 3140 Kellogg Ave
- 2720 Brooks Ct
- 2905 Niagra St Unit 168
- 2905 Niagra St Unit 257
- 2900 Andre Ln Unit 241
- 3178 Andre Ln
- 2405 Bucknell St
- 3361 Vanderbilt Ave
- 680 Sherri Way
- 3360 Stanley Ave
- 225 Fullerton Dr
- 240 W Tuolumne Rd
- 3161 Bridgeport Ct
- 790 Hillsdale Dr
- 200 Drexel Ave
- 2061 Zane Way
- 834 Cedar Ridge Dr
- 517 W Tuolumne Rd
- 805 Cole Ave
Your Personal Tour Guide
Ask me questions while you tour the home.