Estimated Value: $569,000 - $646,000
5
Beds
3
Baths
3,680
Sq Ft
$163/Sq Ft
Est. Value
About This Home
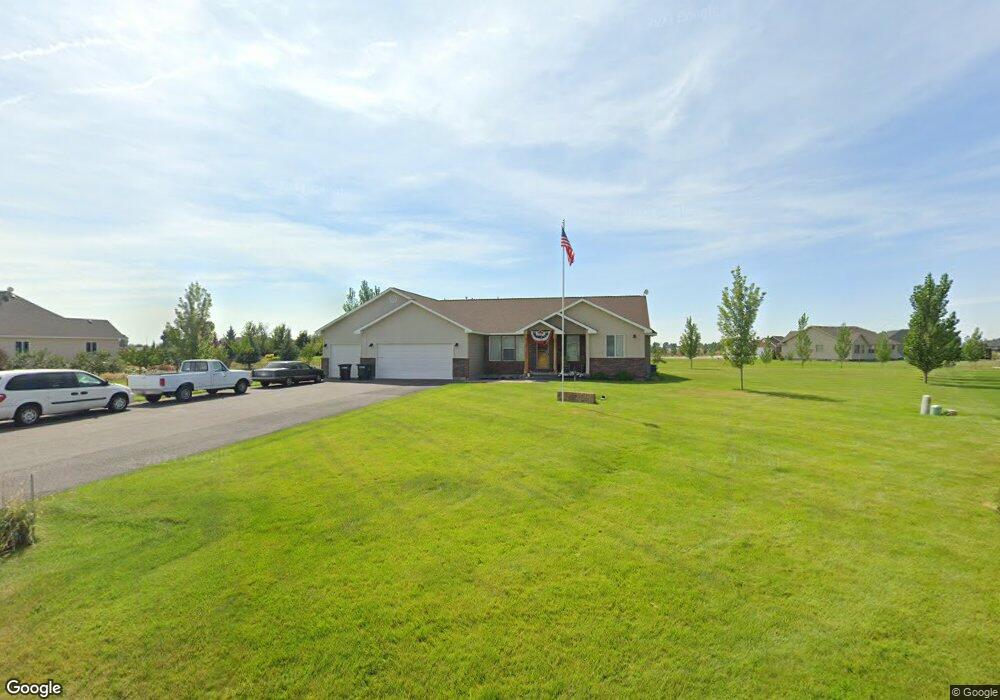
This home is located at 143 N 3721 E, Rigby, ID 83442 and is currently estimated at $601,244, approximately $163 per square foot. 143 N 3721 E is a home located in Jefferson County with nearby schools including Jefferson Elementary School, Rigby Middle School, and Rigby High School.
Ownership History
Date
Name
Owned For
Owner Type
Purchase Details
Closed on
Aug 24, 2015
Sold by
Jacobson Natalie Ann and Jacobson Tyler
Bought by
Jacobson Tyler
Current Estimated Value
Home Financials for this Owner
Home Financials are based on the most recent Mortgage that was taken out on this home.
Original Mortgage
$208,000
Outstanding Balance
$162,358
Interest Rate
4.05%
Mortgage Type
New Conventional
Estimated Equity
$438,886
Purchase Details
Closed on
Apr 1, 2011
Sold by
Girdwood Cherryn and Jacobson Cherryn
Bought by
Jacobson Tyler
Purchase Details
Closed on
Jun 20, 2007
Sold by
Landmark Developments Properties Llc
Bought by
Jacobson Tyler and Jacobson Cherryn
Create a Home Valuation Report for This Property
The Home Valuation Report is an in-depth analysis detailing your home's value as well as a comparison with similar homes in the area
Home Values in the Area
Average Home Value in this Area
Purchase History
| Date | Buyer | Sale Price | Title Company |
|---|---|---|---|
| Jacobson Tyler | -- | First American Title | |
| Jacobson Tyler | -- | -- | |
| Jacobson Tyler | -- | First American Title |
Source: Public Records
Mortgage History
| Date | Status | Borrower | Loan Amount |
|---|---|---|---|
| Open | Jacobson Tyler | $208,000 |
Source: Public Records
Tax History
| Year | Tax Paid | Tax Assessment Tax Assessment Total Assessment is a certain percentage of the fair market value that is determined by local assessors to be the total taxable value of land and additions on the property. | Land | Improvement |
|---|---|---|---|---|
| 2025 | $1,254 | $582,695 | $0 | $0 |
| 2024 | $1,254 | $566,619 | $0 | $0 |
| 2023 | $1,907 | $589,593 | $0 | $0 |
| 2022 | $2,682 | $505,031 | $0 | $0 |
| 2021 | $2,547 | $396,259 | $0 | $0 |
| 2020 | $2,056 | $364,254 | $0 | $0 |
| 2019 | $2,307 | $326,337 | $0 | $0 |
| 2018 | $2,026 | $286,867 | $0 | $0 |
| 2017 | $1,787 | $257,966 | $0 | $0 |
| 2016 | $1,784 | $155,151 | $0 | $0 |
| 2015 | $1,782 | $149,322 | $0 | $0 |
| 2014 | $1,630 | $135,409 | $0 | $0 |
| 2013 | -- | $117,920 | $0 | $0 |
Source: Public Records
Map
Nearby Homes
- 146 N 3729 E
- L13 B4 N 3730 E
- L2 B5 N 3744 E
- L4 B5 N 3744 E
- L5 B5 N 3744 E
- L2 B4 N 3744 E
- L3 B4 N 3744 E
- L3 B5 N 3744 E
- L4 B4 N 3744 E
- L1 B5 N 3744 E
- L1 B4 N 3744 E
- TBD E 100 N
- 3814 E 106 N
- 3815 E 200 N
- L3B1 3744 E
- 3836 E 120 N
- 3698 E Autumn Heights Dr
- 3689 E Autumn Heights Dr
- 2 N 3737 E
- TBD N Annis Hwy
Your Personal Tour Guide
Ask me questions while you tour the home.