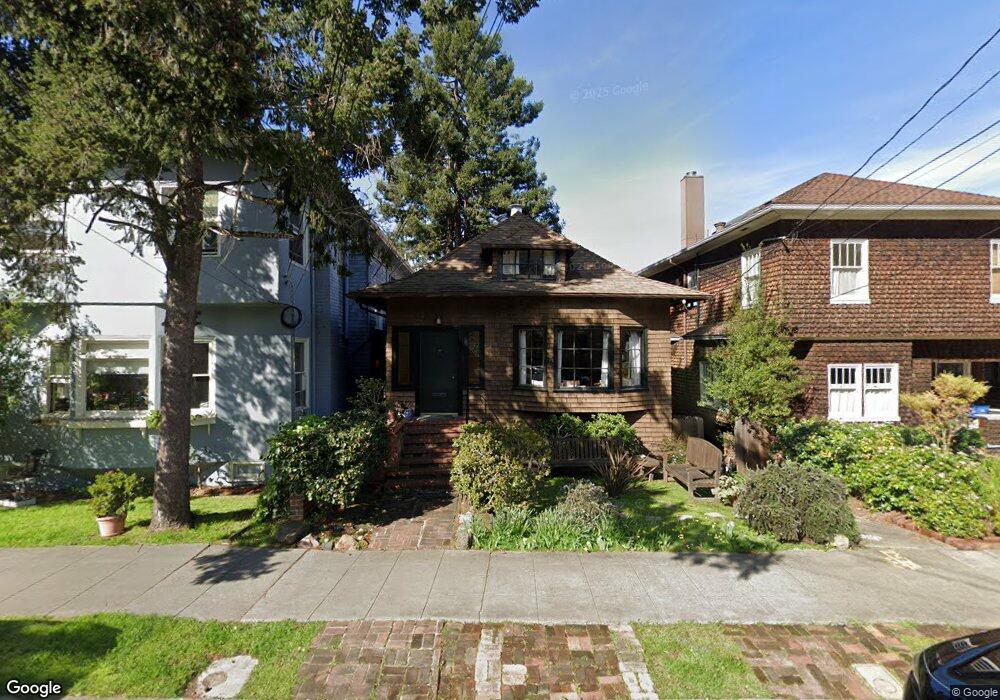
1430 Arch St Berkeley, CA 94708
Berkeley Hills NeighborhoodEstimated Value: $1,303,000 - $1,658,000
2
Beds
1
Bath
1,603
Sq Ft
$885/Sq Ft
Est. Value
About This Home
This home is located at 1430 Arch St, Berkeley, CA 94708 and is currently estimated at $1,417,974, approximately $884 per square foot. 1430 Arch St is a home located in Alameda County with nearby schools including Berkeley Arts Magnet at Whittier School, Cragmont Elementary School, and Washington Elementary School.
Ownership History
Date
Name
Owned For
Owner Type
Purchase Details
Closed on
Apr 14, 2004
Sold by
Fowler Amy
Bought by
Sparks Thomas E
Current Estimated Value
Home Financials for this Owner
Home Financials are based on the most recent Mortgage that was taken out on this home.
Original Mortgage
$252,000
Interest Rate
5.57%
Mortgage Type
New Conventional
Purchase Details
Closed on
Oct 7, 1998
Sold by
Moellering Ralph L and Moellering Tim J
Bought by
Sparks Thomas E
Home Financials for this Owner
Home Financials are based on the most recent Mortgage that was taken out on this home.
Original Mortgage
$216,000
Interest Rate
6.79%
Purchase Details
Closed on
Oct 6, 1994
Sold by
Moellering Ralph L
Bought by
Moellering Ralph L and Moellering Tim J
Create a Home Valuation Report for This Property
The Home Valuation Report is an in-depth analysis detailing your home's value as well as a comparison with similar homes in the area
Home Values in the Area
Average Home Value in this Area
Purchase History
| Date | Buyer | Sale Price | Title Company |
|---|---|---|---|
| Sparks Thomas E | -- | First California Title Co | |
| Sparks Thomas E | $270,000 | Old Republic Title Company | |
| Moellering Ralph L | -- | Commonwealth Land Title Co |
Source: Public Records
Mortgage History
| Date | Status | Borrower | Loan Amount |
|---|---|---|---|
| Closed | Sparks Thomas E | $252,000 | |
| Closed | Sparks Thomas E | $216,000 |
Source: Public Records
Tax History
| Year | Tax Paid | Tax Assessment Tax Assessment Total Assessment is a certain percentage of the fair market value that is determined by local assessors to be the total taxable value of land and additions on the property. | Land | Improvement |
|---|---|---|---|---|
| 2025 | $9,412 | $416,257 | $126,977 | $296,280 |
| 2024 | $9,412 | $407,960 | $124,488 | $290,472 |
| 2023 | $9,144 | $406,824 | $122,047 | $284,777 |
| 2022 | $9,088 | $391,848 | $119,654 | $279,194 |
| 2021 | $9,075 | $384,030 | $117,309 | $273,721 |
| 2020 | $8,523 | $387,020 | $116,106 | $270,914 |
| 2019 | $8,098 | $379,433 | $113,830 | $265,603 |
| 2018 | $7,908 | $371,994 | $111,598 | $260,396 |
| 2017 | $7,616 | $364,701 | $109,410 | $255,291 |
| 2016 | $7,277 | $357,552 | $107,265 | $250,287 |
| 2015 | $7,151 | $352,181 | $105,654 | $246,527 |
| 2014 | $7,047 | $345,283 | $103,585 | $241,698 |
Source: Public Records
Map
Nearby Homes
- 1515 Oxford St Unit 1D
- 1444 Walnut St
- 2501 Rose Walk
- 1622 Scenic Ave
- 2315 Eunice St
- 2121 Eunice St
- 2421 Hilgard Ave
- 1408 Henry St
- 1682 Oxford St
- 2201 Virginia St Unit 2
- 2340 Virginia St
- 2477 Virginia St
- 2451 Le Conte Ave
- 1739 Spruce St
- 2600 Hilgard Ave
- 2686 Shasta Rd
- 1425 Martin Luther King jr Way
- 1610 Milvia St
- 1609 Bonita Ave Unit 5
- 2634 Virginia St Unit 33
- 1428 Arch St
- 1422 Arch St
- 1436 Arch St
- 1416 Arch St
- 1427 Spruce St
- 1425 Spruce St
- 1438 Arch St
- 1429 Spruce St Unit A
- 1429 Spruce St
- 1417 Spruce St Unit F
- 1417 Spruce St Unit E
- 1417 Spruce St Unit D
- 1417 Spruce St Unit C
- 1417 Spruce St Unit B
- 1417 Spruce St Unit A
- 1417 Spruce St Unit G
- 1431 Spruce St
- 1435 Arch St
- 1455 Arch St
- 1410 Arch St
Your Personal Tour Guide
Ask me questions while you tour the home.