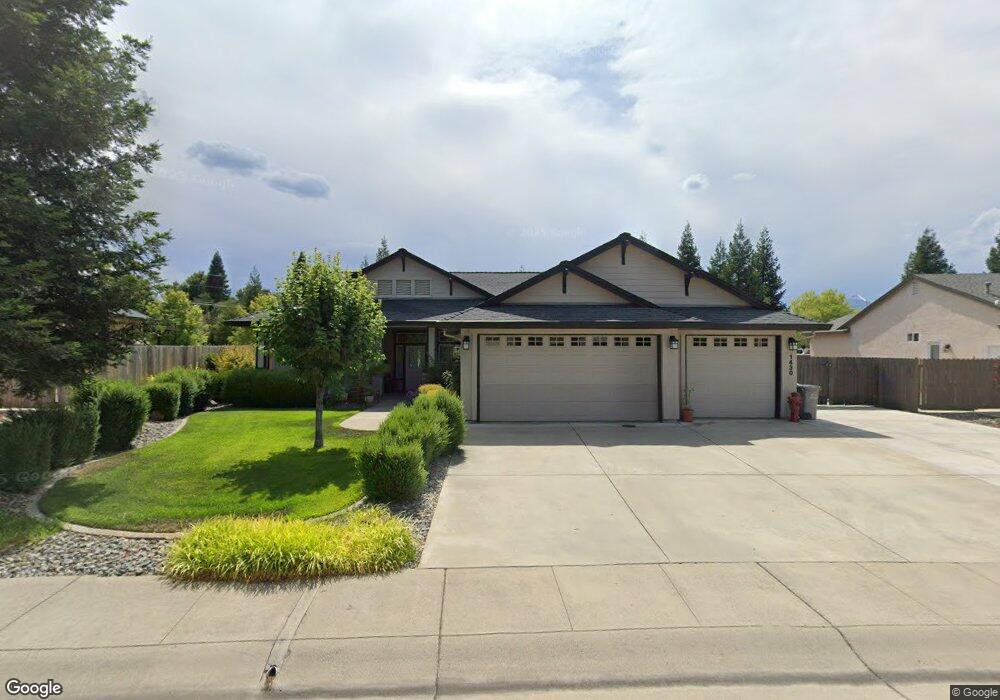
1430 Jen Way Unit Lot 15 Redding, CA 96001
Manzanita NeighborhoodEstimated Value: $530,340 - $647,000
3
Beds
3
Baths
2,048
Sq Ft
$278/Sq Ft
Est. Value
About This Home
This home is located at 1430 Jen Way Unit Lot 15, Redding, CA 96001 and is currently estimated at $568,835, approximately $277 per square foot. 1430 Jen Way Unit Lot 15 is a home located in Shasta County with nearby schools including Manzanita Elementary School, Sequoia Middle School, and Shasta High School.
Ownership History
Date
Name
Owned For
Owner Type
Purchase Details
Closed on
Sep 2, 2021
Sold by
Barnett Robert D
Bought by
Barnett Robert Dale and Robert Dale Barnett Living Tru
Current Estimated Value
Purchase Details
Closed on
Oct 4, 2016
Sold by
Quigley Kenneth
Bought by
Barnett Robert D
Home Financials for this Owner
Home Financials are based on the most recent Mortgage that was taken out on this home.
Original Mortgage
$332,442
Outstanding Balance
$266,261
Interest Rate
3.43%
Mortgage Type
New Conventional
Estimated Equity
$302,574
Purchase Details
Closed on
Dec 21, 2012
Sold by
Quigley Kenneth A
Bought by
Quigley Kenneth
Purchase Details
Closed on
Mar 20, 2008
Sold by
Premier Homes Properties Inc
Bought by
Quigley Kenneth A and Quigley Debra Martin
Home Financials for this Owner
Home Financials are based on the most recent Mortgage that was taken out on this home.
Original Mortgage
$225,000
Interest Rate
6.22%
Mortgage Type
Purchase Money Mortgage
Create a Home Valuation Report for This Property
The Home Valuation Report is an in-depth analysis detailing your home's value as well as a comparison with similar homes in the area
Home Values in the Area
Average Home Value in this Area
Purchase History
| Date | Buyer | Sale Price | Title Company |
|---|---|---|---|
| Barnett Robert Dale | -- | None Available | |
| Barnett Robert D | $365,000 | Placer Title Company | |
| Quigley Kenneth | -- | None Available | |
| Quigley Kenneth A | $390,000 | Placer Title Company |
Source: Public Records
Mortgage History
| Date | Status | Borrower | Loan Amount |
|---|---|---|---|
| Open | Barnett Robert D | $332,442 | |
| Previous Owner | Quigley Kenneth A | $225,000 |
Source: Public Records
Tax History Compared to Growth
Tax History
| Year | Tax Paid | Tax Assessment Tax Assessment Total Assessment is a certain percentage of the fair market value that is determined by local assessors to be the total taxable value of land and additions on the property. | Land | Improvement |
|---|---|---|---|---|
| 2025 | $4,666 | $423,608 | $69,632 | $353,976 |
| 2024 | $4,583 | $415,303 | $68,267 | $347,036 |
| 2023 | $4,583 | $407,161 | $66,929 | $340,232 |
| 2022 | $4,499 | $399,178 | $65,617 | $333,561 |
| 2021 | $4,470 | $391,352 | $64,331 | $327,021 |
| 2020 | $4,503 | $387,340 | $63,672 | $323,668 |
| 2019 | $4,273 | $379,746 | $62,424 | $317,322 |
| 2018 | $4,309 | $372,300 | $61,200 | $311,100 |
| 2017 | $4,093 | $365,000 | $60,000 | $305,000 |
| 2016 | $4,280 | $371,000 | $70,000 | $301,000 |
| 2015 | $3,911 | $355,000 | $65,000 | $290,000 |
| 2014 | $3,925 | $334,000 | $60,000 | $274,000 |
Source: Public Records
Map
Nearby Homes
- 1430 Ridge Dr
- 1474 Gladstone Ct
- 3357 Oakwood Place
- 1355 Bambury Ct
- 1605 Wisconsin Ave
- 1640 Wisconsin Ave
- 3135 Stratford Ave
- 3060 Monte Bello Dr
- 3380 Placer St
- 3036 Monte Bello Dr
- 3330 Scenic Dr
- 4160 Travona Ct
- 925 Hallmark Dr
- 910 Hallmark Dr
- 1675 Lakeside Dr
- 3410 Scenic Dr
- 4648 Kilkee Dr
- 4125 Oro St
- 1756 Mary Lake Dr
- 4181 Haleakala Ave
- 1430 Jen Way
- 1418 Jen Way Unit Lot 16
- 1418 Jen Way
- 1442 Jen Way Unit Lot 14
- 1442 Jen Way
- 1454 Jen Way Unit 13
- 1454 Jen Way
- 1406 Jen Way Unit 17
- 1406 Jen Way
- 1447 Jen Way Unit Lot 33
- 1447 Jen Way
- 1427 Jen Way Unit Lot 34
- 1427 Jen Way
- 1467 Jen Way Unit Lot 32
- 1467 Jen Way
- 2090 Buenaventura Blvd
- Lot 6 Buenaventura Blvd
- 0 Buenaventura Blvd
- 1466 Jen Way Unit Lot 12
- 1466 Jen Way