1430 Le Roy Ave Berkeley, CA 94708
Berkeley Hills NeighborhoodEstimated Value: $1,645,000 - $1,943,000
4
Beds
3
Baths
2,278
Sq Ft
$781/Sq Ft
Est. Value
About This Home
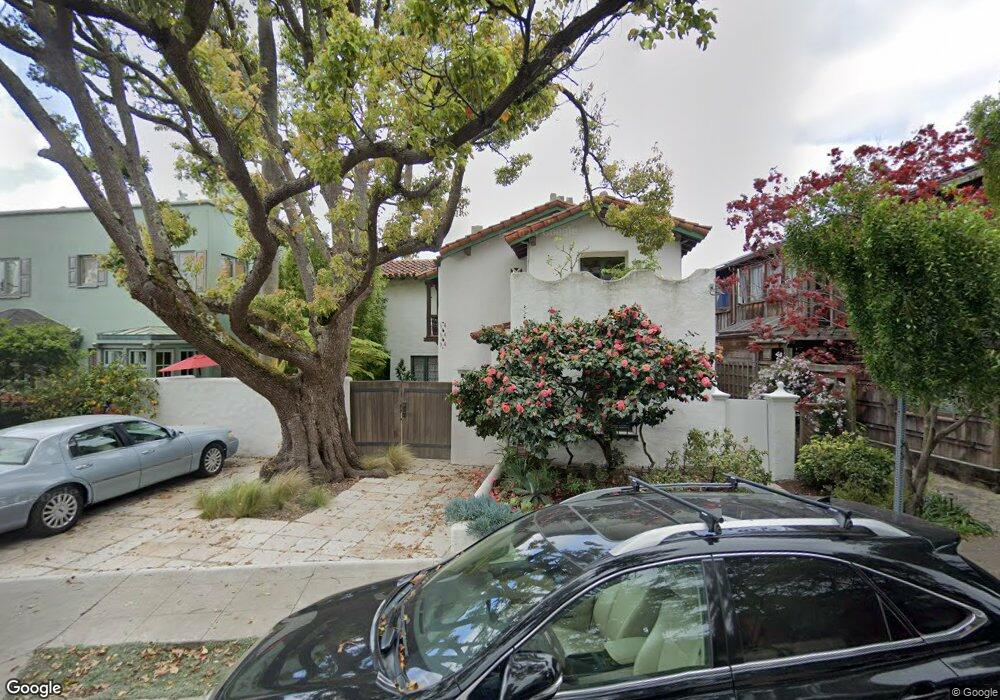
This home is located at 1430 Le Roy Ave, Berkeley, CA 94708 and is currently estimated at $1,778,959, approximately $780 per square foot. 1430 Le Roy Ave is a home located in Alameda County with nearby schools including Berkeley Arts Magnet at Whittier School, Cragmont Elementary School, and Washington Elementary School.
Ownership History
Date
Name
Owned For
Owner Type
Purchase Details
Closed on
Aug 14, 2003
Sold by
Salveson Michael and Salveson Georgette
Bought by
Salveson Michael and Salveson Georgette
Current Estimated Value
Create a Home Valuation Report for This Property
The Home Valuation Report is an in-depth analysis detailing your home's value as well as a comparison with similar homes in the area
Home Values in the Area
Average Home Value in this Area
Purchase History
| Date | Buyer | Sale Price | Title Company |
|---|---|---|---|
| Salveson Michael | -- | -- |
Source: Public Records
Tax History
| Year | Tax Paid | Tax Assessment Tax Assessment Total Assessment is a certain percentage of the fair market value that is determined by local assessors to be the total taxable value of land and additions on the property. | Land | Improvement |
|---|---|---|---|---|
| 2025 | $8,156 | $209,802 | $131,967 | $84,835 |
| 2024 | $8,156 | $205,551 | $129,380 | $83,171 |
| 2023 | $7,891 | $208,384 | $126,843 | $81,541 |
| 2022 | $7,808 | $197,298 | $124,356 | $79,942 |
| 2021 | $7,760 | $193,293 | $121,918 | $78,375 |
| 2020 | $7,159 | $198,239 | $120,668 | $77,571 |
| 2019 | $6,656 | $194,352 | $118,302 | $76,050 |
| 2018 | $6,404 | $190,542 | $115,983 | $74,559 |
| 2017 | $6,720 | $186,807 | $113,709 | $73,098 |
| 2016 | $6,320 | $183,144 | $111,480 | $71,664 |
| 2015 | $6,186 | $180,393 | $109,805 | $70,588 |
| 2014 | $5,995 | $176,861 | $107,655 | $69,206 |
Source: Public Records
Map
Nearby Homes
- 1400 Le Roy Ave
- 2501 Rose Walk
- 1471 Scenic Ave
- 2893 Buena Vista Way
- 2686 Shasta Rd
- 1622 Scenic Ave
- 2315 Eunice St
- 2600 Hilgard Ave
- 2477 Virginia St
- 1412 Oxford St
- 1519 Oxford St Unit E
- 2365 Virginia St Unit 2
- 1698 La Loma Ave Unit 1698
- 1179 Keith Ave
- 2634 Virginia St Unit 13
- 2451 Le Conte Ave
- 2340 Virginia St
- 1444 Walnut St
- 2121 Eunice St
- 1165 Cragmont Ave
- 1404 Le Roy Ave
- 1440 Le Roy Ave
- 1454 Le Roy Ave
- 1421 Euclid Ave
- 1429 Euclid Ave
- 1407 Euclid Ave Unit .1
- 1407 Euclid Ave
- 2518 Rose Walk
- 1435 Euclid Ave
- 1429 Le Roy Ave
- 1464 Le Roy Ave
- 1439 Le Roy Ave
- 2525 Hawthorne Terrace
- 2500 Rose Walk
- 1445 Euclid Ave
- 1401 Le Roy Ave
- 2519 Hawthorne Terrace
- 2535 Hawthorne Terrace
- 1480 Le Roy Ave
- 2567 Rose St
Your Personal Tour Guide
Ask me questions while you tour the home.