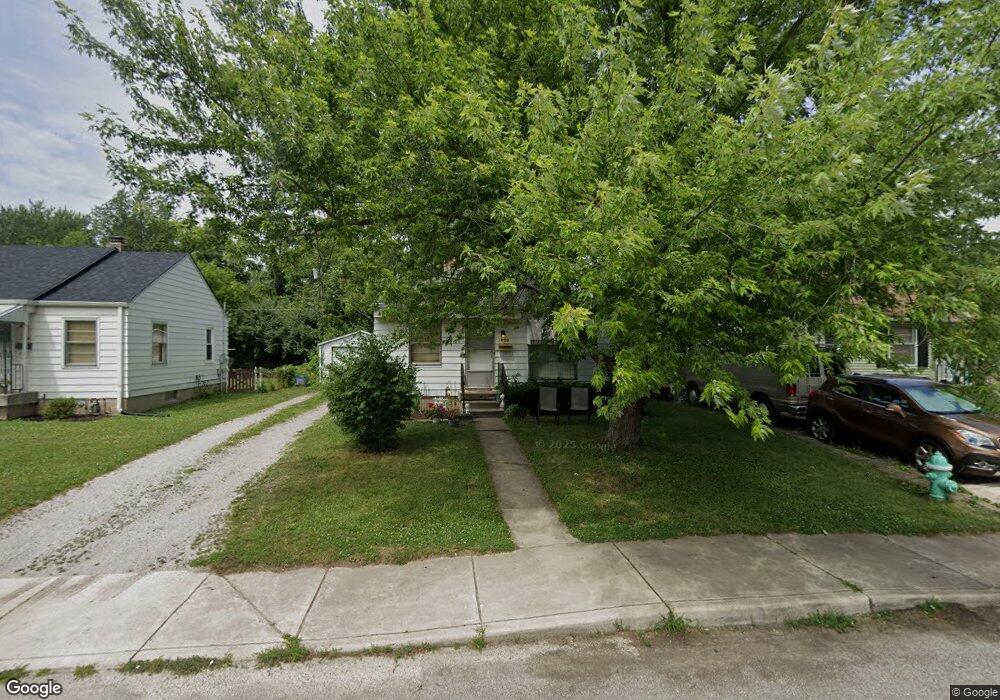
1430 N Kenmore Rd Indianapolis, IN 46219
Eastside NeighborhoodEstimated Value: $115,000 - $154,000
2
Beds
1
Bath
1,440
Sq Ft
$99/Sq Ft
Est. Value
About This Home
This home is located at 1430 N Kenmore Rd, Indianapolis, IN 46219 and is currently estimated at $142,723, approximately $99 per square foot. 1430 N Kenmore Rd is a home located in Marion County with nearby schools including Thomas D. Gregg School No. 15, Washington Irving School 14, and Anna Brochhausen School 88.
Ownership History
Date
Name
Owned For
Owner Type
Purchase Details
Closed on
Feb 17, 2009
Sold by
Fannie Mae
Bought by
Jett Jesse L
Current Estimated Value
Home Financials for this Owner
Home Financials are based on the most recent Mortgage that was taken out on this home.
Original Mortgage
$32,156
Outstanding Balance
$20,119
Interest Rate
4.91%
Mortgage Type
FHA
Estimated Equity
$122,604
Purchase Details
Closed on
Nov 10, 2008
Sold by
Fussner Kathy
Bought by
Gmac Mortgage Llc and Gmac Mortgage Corporation
Purchase Details
Closed on
Sep 29, 2006
Sold by
Burham James and Burham Catherine R
Bought by
Fussner Kathy J
Home Financials for this Owner
Home Financials are based on the most recent Mortgage that was taken out on this home.
Original Mortgage
$52,200
Interest Rate
6.49%
Mortgage Type
New Conventional
Purchase Details
Closed on
Mar 1, 2006
Sold by
Durham Catherine R
Bought by
Durham James and Durham Catherine R
Create a Home Valuation Report for This Property
The Home Valuation Report is an in-depth analysis detailing your home's value as well as a comparison with similar homes in the area
Home Values in the Area
Average Home Value in this Area
Purchase History
| Date | Buyer | Sale Price | Title Company |
|---|---|---|---|
| Jett Jesse L | -- | Title One | |
| Gmac Mortgage Llc | $46,855 | None Available | |
| Fussner Kathy J | -- | None Available | |
| Durham James | -- | None Available |
Source: Public Records
Mortgage History
| Date | Status | Borrower | Loan Amount |
|---|---|---|---|
| Open | Jett Jesse L | $32,156 | |
| Previous Owner | Fussner Kathy J | $52,200 |
Source: Public Records
Tax History Compared to Growth
Tax History
| Year | Tax Paid | Tax Assessment Tax Assessment Total Assessment is a certain percentage of the fair market value that is determined by local assessors to be the total taxable value of land and additions on the property. | Land | Improvement |
|---|---|---|---|---|
| 2024 | $1,986 | $87,800 | $11,800 | $76,000 |
| 2023 | $1,986 | $80,800 | $11,800 | $69,000 |
| 2022 | $1,841 | $75,100 | $11,800 | $63,300 |
| 2021 | $1,589 | $66,000 | $11,800 | $54,200 |
| 2020 | $1,476 | $60,900 | $10,900 | $50,000 |
| 2019 | $1,424 | $57,600 | $10,900 | $46,700 |
| 2018 | $1,347 | $53,900 | $10,900 | $43,000 |
| 2017 | $1,215 | $54,300 | $10,900 | $43,400 |
| 2016 | $1,039 | $47,100 | $10,900 | $36,200 |
| 2014 | $5 | $48,900 | $10,900 | $38,000 |
| 2013 | $5 | $52,800 | $10,900 | $41,900 |
Source: Public Records
Map
Nearby Homes
- 6148 E 13th St
- 6495 E 14th St
- 6259 E 11th St
- 1414 Priscilla Ave
- 1726 N Campbell Ave
- 5911 E 18th St
- 1425 N Bolton Ave
- 6644 E 18th St
- 5856 E 18th St
- 6676 E 18th St
- 6753 E 17th St
- 7011 E 14th St
- 1020 N Graham Ave
- 961 N Audubon Rd
- 770 N Arlington Ave
- 1959 N Graham Ave
- 1852 N Audubon Rd
- 955 N Lesley Ave
- 1141 N Shadeland Ave
- 1924 N Lesley Ave
- 1424 N Kenmore Rd
- 1436 N Kenmore Rd
- 6223 E 15th St
- 1418 N Kenmore Rd
- 1442 N Kenmore Rd
- 6217 E 15th St
- 1423 N Kenmore Rd
- 6224 E 14th St
- 1412 N Kenmore Rd
- 1435 N Kenmore Rd
- 6218 E 14th St
- 1406 N Kenmore Rd
- 1429 N Sheridan Ave
- 1435 N Sheridan Ave
- 1423 N Sheridan Ave
- 1441 N Sheridan Ave
- 1417 N Sheridan Ave
- 1512 N Kenmore Rd
- 6224 E 15th St
- 1511 N Kenmore Rd