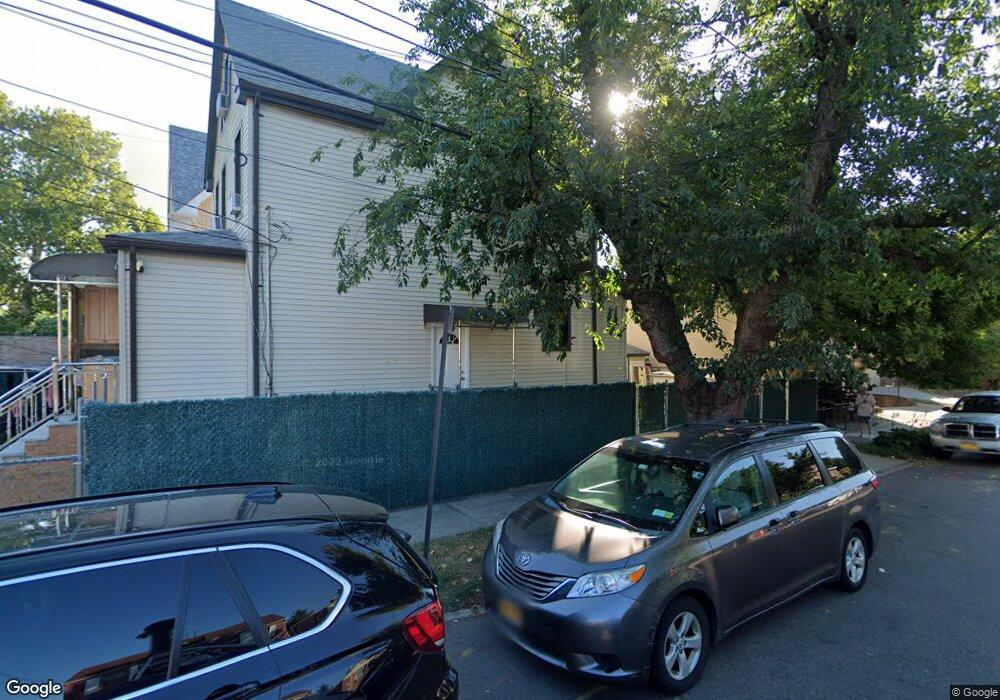
14302 Negundo Ave Flushing, NY 11355
East Flushing NeighborhoodEstimated Value: $1,068,610 - $1,450,000
Studio
--
Bath
1,684
Sq Ft
$753/Sq Ft
Est. Value
About This Home
This home is located at 14302 Negundo Ave, Flushing, NY 11355 and is currently estimated at $1,267,403, approximately $752 per square foot. 14302 Negundo Ave is a home located in Queens County with nearby schools including P.S. 024 Andrew Jackson School, Rachel Carson I.S. 237Q, and Francis Lewis High School.
Ownership History
Date
Name
Owned For
Owner Type
Purchase Details
Closed on
Sep 4, 2008
Sold by
Reyes Alberto
Bought by
Huang Jian Fei and Wang Yi Fang
Current Estimated Value
Home Financials for this Owner
Home Financials are based on the most recent Mortgage that was taken out on this home.
Original Mortgage
$170,000
Outstanding Balance
$112,255
Interest Rate
6.54%
Mortgage Type
Purchase Money Mortgage
Estimated Equity
$1,155,148
Purchase Details
Closed on
Mar 30, 2007
Sold by
Arismendy James
Bought by
Reyes Alberto
Home Financials for this Owner
Home Financials are based on the most recent Mortgage that was taken out on this home.
Original Mortgage
$180,000
Interest Rate
6.24%
Purchase Details
Closed on
Jun 4, 1997
Sold by
143-02 Negundo Avenue Corp
Bought by
Arismendy James R
Create a Home Valuation Report for This Property
The Home Valuation Report is an in-depth analysis detailing your home's value as well as a comparison with similar homes in the area
Home Values in the Area
Average Home Value in this Area
Purchase History
| Date | Buyer | Sale Price | Title Company |
|---|---|---|---|
| Huang Jian Fei | $460,000 | -- | |
| Huang Jian Fei | $460,000 | -- | |
| Reyes Alberto | $720,000 | -- | |
| Reyes Alberto | $720,000 | -- | |
| Arismendy James R | -- | Lawyers Title Insurance Corp | |
| Arismendy James R | -- | Lawyers Title Insurance Corp |
Source: Public Records
Mortgage History
| Date | Status | Borrower | Loan Amount |
|---|---|---|---|
| Open | Huang Jian Fei | $170,000 | |
| Closed | Huang Jian Fei | $170,000 | |
| Previous Owner | Reyes Alberto | $180,000 | |
| Previous Owner | Reyes Alberto | $540,000 |
Source: Public Records
Tax History
| Year | Tax Paid | Tax Assessment Tax Assessment Total Assessment is a certain percentage of the fair market value that is determined by local assessors to be the total taxable value of land and additions on the property. | Land | Improvement |
|---|---|---|---|---|
| 2025 | $6,997 | $36,924 | $9,300 | $27,624 |
| 2024 | $6,997 | $34,836 | $8,750 | $26,086 |
| 2023 | $6,908 | $34,396 | $7,834 | $26,562 |
| 2022 | $6,523 | $74,460 | $16,140 | $58,320 |
| 2021 | $6,864 | $61,740 | $16,140 | $45,600 |
| 2020 | $6,513 | $60,540 | $16,140 | $44,400 |
| 2019 | $6,073 | $61,860 | $16,140 | $45,720 |
| 2018 | $5,843 | $28,663 | $8,576 | $20,087 |
| 2017 | $5,550 | $27,228 | $9,688 | $17,540 |
| 2016 | $5,434 | $27,228 | $9,688 | $17,540 |
| 2015 | $3,098 | $25,642 | $12,074 | $13,568 |
| 2014 | $3,098 | $24,192 | $10,748 | $13,444 |
Source: Public Records
Map
Nearby Homes
- 146-18 Laburnum Ave
- 146-23 Laburnum Ave
- 52-06 Bowne St
- 143-16 Holly Ave
- 52-05 Robinson St
- 14014 Poplar Ave
- 140-50 Quince Ave
- 50-16 Kissena Blvd
- 46-40 Kissena Blvd
- 148-10 Kalmia Ave
- 148-29 Laburnum Ave
- 148-24 Kalmia Ave
- 140-19 Rose Ave
- 148-11 Kalmia Ave
- 45-30 Smart St
- 45-24 Burling St
- 152-12 Peck Ave
- 157-18 Laburnum Ave
- 152-10 Peck Ave
- 157-51 Rose Ave
- 14304 Negundo Ave
- 14327 Negundo Ave
- 49-09 Negundo Ave
- 14310 Negundo Ave
- 49-11 Negundo Ave
- 4906 Bowne St
- 4902 Bowne St
- 14314 Negundo Ave
- 14314 Negundo Ave
- 4910 Bowne St
- 14303 Oak Ave
- 14301 Negundo Ave
- 14303 Negundo Ave
- 14307 Oak Ave
- 14307 Negundo Ave
- 142-17 Negundo Ave
- 14212 Negundo Ave
- 4912 Smart St
- 14217 Negundo Ave
- 14217 Oak Ave
Your Personal Tour Guide
Ask me questions while you tour the home.