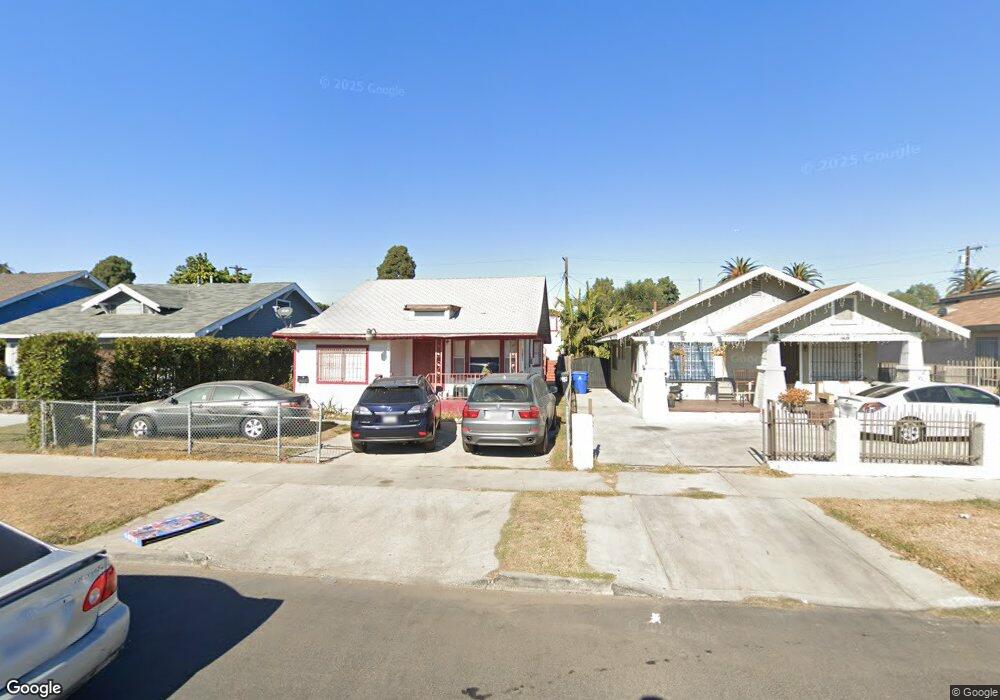
1431 W 56th St Los Angeles, CA 90062
Harvard Park NeighborhoodEstimated Value: $727,000 - $992,000
4
Beds
3
Baths
2,191
Sq Ft
$389/Sq Ft
Est. Value
About This Home
This home is located at 1431 W 56th St, Los Angeles, CA 90062 and is currently estimated at $851,333, approximately $388 per square foot. 1431 W 56th St is a home located in Los Angeles County with nearby schools including Western Avenue Technology Magnet, Barack Obama Global Preparation Academy, and Augustus F. Hawkins High A Critical Design And Gaming.
Ownership History
Date
Name
Owned For
Owner Type
Purchase Details
Closed on
Jul 26, 2019
Sold by
Roberson Martha J and The Martha J Roberson Living T
Bought by
Roberson Martha J and The Martha J Roberson Living T
Current Estimated Value
Purchase Details
Closed on
Feb 6, 2019
Sold by
Bell Barrington C
Bought by
Roberson Martha J and Martha J Roberson Living Trust
Purchase Details
Closed on
Jan 15, 2013
Sold by
Roberson Martha J and Martha J Roberson Living Trust
Bought by
Roberson Martha J and Martha J Roberson Living Trust
Purchase Details
Closed on
Jul 25, 2011
Sold by
Roberson Martha J
Bought by
Roberson Martha J and Martha J Roberson Living Trust
Purchase Details
Closed on
Feb 21, 2007
Sold by
Jackson Delphine and Delphine Jackson Living Trust
Bought by
Jackson Delphine and Roberson Martha J
Purchase Details
Closed on
Jan 22, 1999
Sold by
Jackson Delphine
Bought by
Jackson Delphine and The Delphine Jackson Living Tr
Create a Home Valuation Report for This Property
The Home Valuation Report is an in-depth analysis detailing your home's value as well as a comparison with similar homes in the area
Home Values in the Area
Average Home Value in this Area
Purchase History
| Date | Buyer | Sale Price | Title Company |
|---|---|---|---|
| Roberson Martha J | -- | None Available | |
| Roberson Martha J | -- | None Available | |
| Roberson Martha J | -- | None Available | |
| Roberson Martha J | -- | None Available | |
| Jackson Delphine | -- | None Available | |
| Jackson Delphine | -- | -- |
Source: Public Records
Tax History Compared to Growth
Tax History
| Year | Tax Paid | Tax Assessment Tax Assessment Total Assessment is a certain percentage of the fair market value that is determined by local assessors to be the total taxable value of land and additions on the property. | Land | Improvement |
|---|---|---|---|---|
| 2025 | $9,766 | $803,667 | $467,829 | $335,838 |
| 2024 | $9,766 | $787,909 | $458,656 | $329,253 |
| 2023 | $9,582 | $772,461 | $449,663 | $322,798 |
| 2022 | $9,145 | $757,316 | $440,847 | $316,469 |
| 2021 | $9,023 | $742,467 | $432,203 | $310,264 |
| 2020 | $9,196 | $734,855 | $427,772 | $307,083 |
| 2019 | $2,280 | $176,040 | $112,523 | $63,517 |
| 2018 | $2,185 | $172,589 | $110,317 | $62,272 |
| 2016 | $2,066 | $165,888 | $106,034 | $59,854 |
| 2015 | $2,037 | $163,397 | $104,442 | $58,955 |
| 2014 | $2,062 | $160,198 | $102,397 | $57,801 |
Source: Public Records
Map
Nearby Homes
- 5415 S Normandie Ave
- 1514 W 55th St
- 1506 W 54th St
- 1462 W 53rd St
- 1435 W 53rd St
- 1501 W 53rd St
- 5211 Halldale Ave
- 1453 W 58th Place
- 1500 W 52nd St
- 5321 Denker Ave
- 5164 Halldale Ave
- 1630 W 54th St
- 1340 W 58th Place
- 5217 Denker Ave
- 1407 W 59th Place
- 1649 W 56th St
- 1320 W 58th Place
- 1205 W 57th St
- 1500 W 59th St
- 1320 W 51st Place
- 1429 W 56th St
- 1437 W 56th St
- 1425 W 56th St
- 1441 W 56th St
- 1419 W 56th St
- 1445 W 56th St
- 1432 W 55th St
- 1447 W 56th St
- 1428 W 55th St
- 1436 W 55th St
- 1424 W 55th St
- 1417 W 56th St
- 1449 W 56th St
- 1440 W 55th St
- 1418 W 55th St
- 1444 W 55th St
- 1432 W 56th St
- 1428 W 56th St
- 1436 W 56th St
- 1453 W 56th St Unit 1