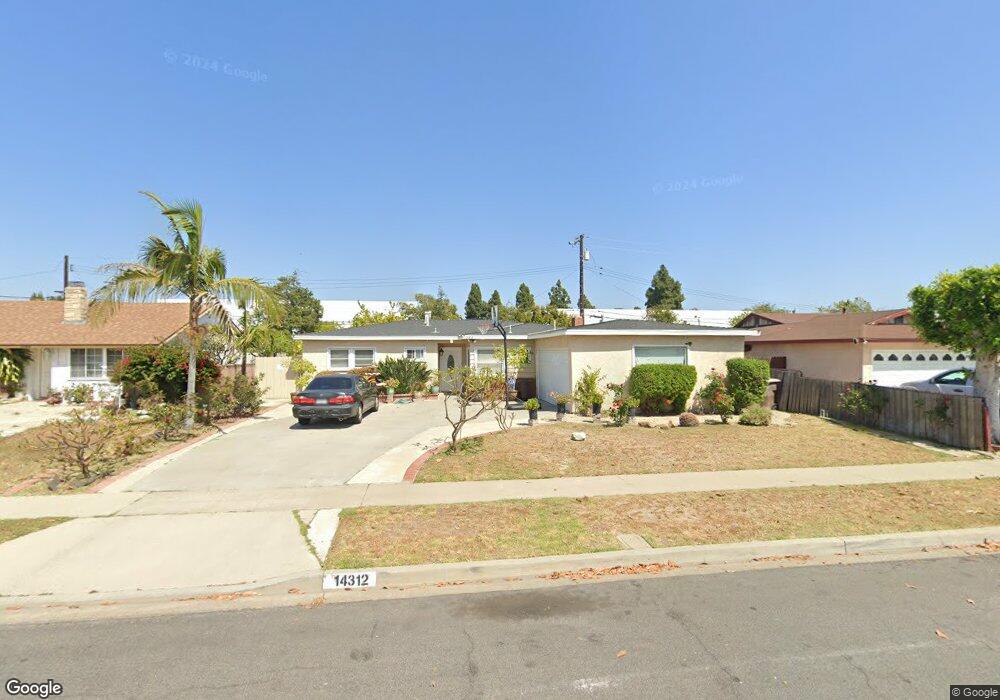
14312 Taft St Garden Grove, CA 92843
Little Saigon NeighborhoodEstimated Value: $973,599 - $1,058,000
3
Beds
2
Baths
1,322
Sq Ft
$771/Sq Ft
Est. Value
About This Home
This home is located at 14312 Taft St, Garden Grove, CA 92843 and is currently estimated at $1,018,900, approximately $770 per square foot. 14312 Taft St is a home located in Orange County with nearby schools including Morningside Elementary School, James Irvine Intermediate School, and Bolsa Grande High School.
Ownership History
Date
Name
Owned For
Owner Type
Purchase Details
Closed on
Sep 9, 2002
Sold by
Thai Kenny Dieu and Thai Donny
Bought by
Thai Kenny Dieu and Thai Donny
Current Estimated Value
Purchase Details
Closed on
Feb 11, 2002
Sold by
Smith Michael and Smith Evelyn
Bought by
Thai Kenny Dieu and Thai Donny
Home Financials for this Owner
Home Financials are based on the most recent Mortgage that was taken out on this home.
Original Mortgage
$256,500
Outstanding Balance
$105,535
Interest Rate
6.99%
Estimated Equity
$913,365
Purchase Details
Closed on
Dec 14, 2001
Sold by
Dula Freda
Bought by
Smith Michael and Smith Evelyn
Home Financials for this Owner
Home Financials are based on the most recent Mortgage that was taken out on this home.
Original Mortgage
$256,500
Outstanding Balance
$105,535
Interest Rate
6.99%
Estimated Equity
$913,365
Purchase Details
Closed on
Apr 3, 1995
Sold by
Dula Freda M
Bought by
Dula Freda Mae and Freda Mae Dula Separate Property Trust
Create a Home Valuation Report for This Property
The Home Valuation Report is an in-depth analysis detailing your home's value as well as a comparison with similar homes in the area
Home Values in the Area
Average Home Value in this Area
Purchase History
| Date | Buyer | Sale Price | Title Company |
|---|---|---|---|
| Thai Kenny Dieu | -- | -- | |
| Thai Kenny Dieu | $285,000 | -- | |
| Smith Michael | $190,000 | First American Title Co | |
| Dula Freda Mae | -- | -- |
Source: Public Records
Mortgage History
| Date | Status | Borrower | Loan Amount |
|---|---|---|---|
| Open | Thai Kenny Dieu | $256,500 |
Source: Public Records
Tax History Compared to Growth
Tax History
| Year | Tax Paid | Tax Assessment Tax Assessment Total Assessment is a certain percentage of the fair market value that is determined by local assessors to be the total taxable value of land and additions on the property. | Land | Improvement |
|---|---|---|---|---|
| 2025 | $5,291 | $421,021 | $343,287 | $77,734 |
| 2024 | $5,291 | $412,766 | $336,556 | $76,210 |
| 2023 | $5,193 | $404,673 | $329,957 | $74,716 |
| 2022 | $5,083 | $396,739 | $323,488 | $73,251 |
| 2021 | $5,029 | $388,960 | $317,145 | $71,815 |
| 2020 | $4,963 | $384,972 | $313,893 | $71,079 |
| 2019 | $4,869 | $377,424 | $307,738 | $69,686 |
| 2018 | $4,772 | $370,024 | $301,704 | $68,320 |
| 2017 | $4,707 | $362,769 | $295,788 | $66,981 |
| 2016 | $4,477 | $355,656 | $289,988 | $65,668 |
| 2015 | $4,415 | $350,314 | $285,632 | $64,682 |
| 2014 | $4,308 | $343,452 | $280,037 | $63,415 |
Source: Public Records
Map
Nearby Homes
- 14356 Taft St
- 14151 Lake St
- 10866 Westminster Ave Unit 17
- 10866 Westminster Ave Unit 1
- 10866 Westminster Ave Unit 10
- 13322 Euclid St
- 5010 W Maurie Ave
- 5317 Silver Dr
- 5405 W 4th St
- 4816 Irongate Ln
- 14171 Flower St Unit 13
- 323 N Euclid St Unit 99
- 13801 Shirley St Unit 25
- 1609 N Parsons Place
- 4832 W 5th St Unit B
- 10061 15th St
- 11321 Parkgreen Ln Unit 102
- 13611 Glenhaven Dr
- 5112 W 1st St Unit C
- 9884 11th St
- 14302 Taft St
- 14322 Taft St
- 14282 Taft St
- 14342 Taft St
- 14311 Taft St
- 14301 Taft St
- 14321 Taft St
- 14352 Taft St
- 14281 Taft St
- 14341 Taft St
- 14312 Pleasant St
- 14302 Pleasant St
- 14351 Taft St
- 14322 Pleasant St
- 10731 Jennrich Ave
- 10721 Jennrich Ave
- 14282 Pleasant St
- 10711 Jennrich Ave
- 14342 Pleasant St
- 10701 Jennrich Ave