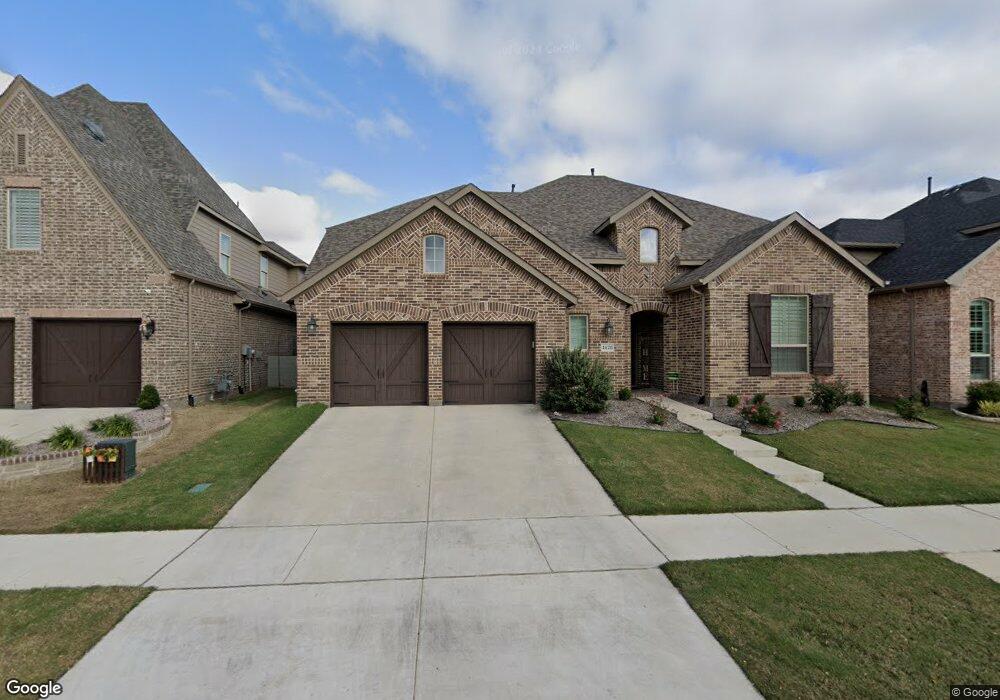
1433 8th St Argyle, TX 76226
Harvest NeighborhoodEstimated Value: $510,000 - $563,000
4
Beds
3
Baths
2,579
Sq Ft
$206/Sq Ft
Est. Value
About This Home
This home is located at 1433 8th St, Argyle, TX 76226 and is currently estimated at $530,125, approximately $205 per square foot. 1433 8th St is a home with nearby schools including Argyle West, Argyle Middle School, and Argyle High School.
Ownership History
Date
Name
Owned For
Owner Type
Purchase Details
Closed on
Jul 29, 2016
Sold by
Mhi Partnership Ltd
Bought by
Wray David Michael and Wray Anahi Marisela
Current Estimated Value
Home Financials for this Owner
Home Financials are based on the most recent Mortgage that was taken out on this home.
Original Mortgage
$367,973
Outstanding Balance
$294,167
Interest Rate
3.54%
Mortgage Type
VA
Estimated Equity
$235,958
Purchase Details
Closed on
Mar 3, 2016
Sold by
Harvest Phase Ii Llc
Bought by
Mhi Partnership Ltd
Create a Home Valuation Report for This Property
The Home Valuation Report is an in-depth analysis detailing your home's value as well as a comparison with similar homes in the area
Home Values in the Area
Average Home Value in this Area
Purchase History
| Date | Buyer | Sale Price | Title Company |
|---|---|---|---|
| Wray David Michael | -- | Stewart | |
| Mhi Partnership Ltd | -- | Stc |
Source: Public Records
Mortgage History
| Date | Status | Borrower | Loan Amount |
|---|---|---|---|
| Open | Wray David Michael | $367,973 |
Source: Public Records
Tax History
| Year | Tax Paid | Tax Assessment Tax Assessment Total Assessment is a certain percentage of the fair market value that is determined by local assessors to be the total taxable value of land and additions on the property. | Land | Improvement |
|---|---|---|---|---|
| 2025 | $9,708 | $541,717 | $167,786 | $390,673 |
| 2024 | $10,513 | $492,470 | $0 | $0 |
| 2023 | $8,679 | $447,700 | $108,413 | $494,416 |
| 2022 | $11,268 | $407,000 | $108,413 | $363,787 |
| 2021 | $10,633 | $370,000 | $92,925 | $277,075 |
| 2020 | $10,716 | $358,000 | $92,925 | $265,075 |
| 2019 | $10,697 | $345,000 | $92,925 | $252,075 |
| 2018 | $10,084 | $345,000 | $92,925 | $252,075 |
| 2017 | $10,075 | $345,222 | $92,925 | $252,297 |
| 2016 | $891 | $46,463 | $46,463 | $0 |
Source: Public Records
Map
Nearby Homes
Your Personal Tour Guide
Ask me questions while you tour the home.