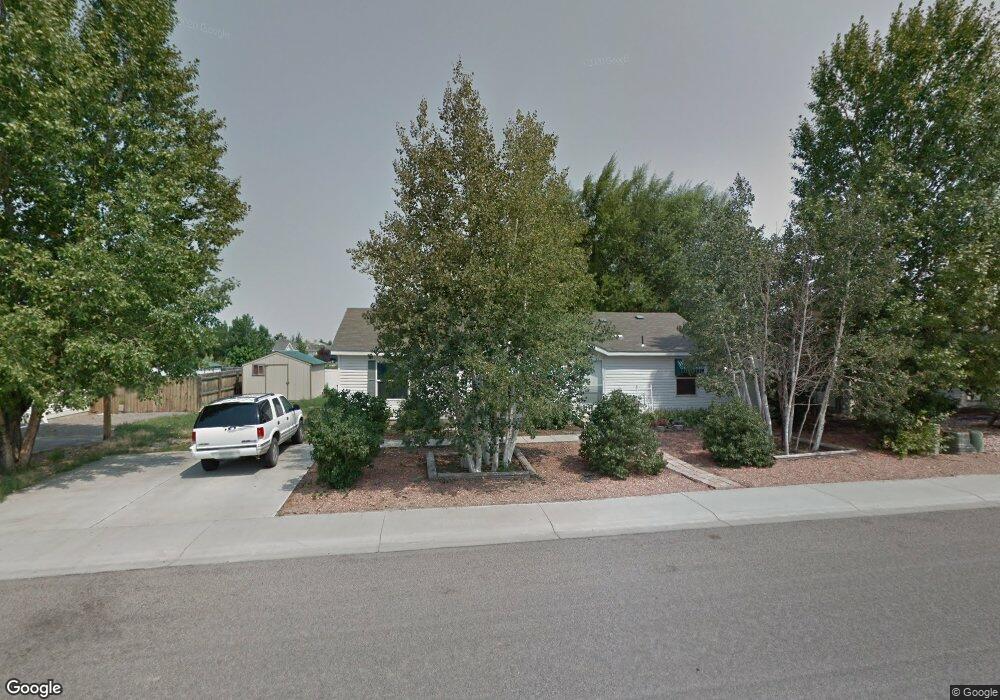
1433 Haystack Rd Montrose, CO 81401
Estimated Value: $197,652 - $321,000
3
Beds
2
Baths
1,272
Sq Ft
$214/Sq Ft
Est. Value
About This Home
This home is located at 1433 Haystack Rd, Montrose, CO 81401 and is currently estimated at $272,413, approximately $214 per square foot. 1433 Haystack Rd is a home located in Montrose County with nearby schools including Johnson Elementary School, Centennial Middle School, and Montrose High School.
Ownership History
Date
Name
Owned For
Owner Type
Purchase Details
Closed on
Jun 1, 2017
Sold by
Miller Melissa P
Bought by
Ryburn David A and Ryburn Sharon
Current Estimated Value
Home Financials for this Owner
Home Financials are based on the most recent Mortgage that was taken out on this home.
Original Mortgage
$125,681
Outstanding Balance
$102,566
Interest Rate
3.87%
Mortgage Type
FHA
Estimated Equity
$169,847
Purchase Details
Closed on
Feb 22, 2008
Sold by
Hill Debra J
Bought by
Miller Melissa P
Home Financials for this Owner
Home Financials are based on the most recent Mortgage that was taken out on this home.
Original Mortgage
$3,544
Interest Rate
5.88%
Purchase Details
Closed on
Oct 30, 2000
Sold by
Jacox Margaret Ruth
Bought by
Hill Debra J
Purchase Details
Closed on
Apr 28, 2000
Sold by
Cj Montrose Capital Llc
Bought by
Jacox Margaret Ruth
Create a Home Valuation Report for This Property
The Home Valuation Report is an in-depth analysis detailing your home's value as well as a comparison with similar homes in the area
Purchase History
| Date | Buyer | Sale Price | Title Company |
|---|---|---|---|
| Ryburn David A | $128,000 | Fidelity National Title | |
| Miller Melissa P | $120,000 | United Title Company | |
| Hill Debra J | -- | -- | |
| Jacox Margaret Ruth | $21,000 | -- |
Source: Public Records
Mortgage History
| Date | Status | Borrower | Loan Amount |
|---|---|---|---|
| Open | Ryburn David A | $125,681 | |
| Previous Owner | Miller Melissa P | $3,544 |
Source: Public Records
Tax History
| Year | Tax Paid | Tax Assessment Tax Assessment Total Assessment is a certain percentage of the fair market value that is determined by local assessors to be the total taxable value of land and additions on the property. | Land | Improvement |
|---|---|---|---|---|
| 2025 | $1,243 | $35,750 | $18,950 | $16,800 |
| 2024 | $1,243 | $13,100 | $2,610 | $10,490 |
| 2023 | $944 | $17,420 | $3,480 | $13,940 |
| 2022 | $826 | $11,830 | $2,430 | $9,400 |
| 2021 | $850 | $12,170 | $2,500 | $9,670 |
| 2020 | $725 | $10,660 | $2,070 | $8,590 |
| 2019 | $729 | $10,660 | $2,070 | $8,590 |
| 2018 | $607 | $8,640 | $1,670 | $6,970 |
| 2017 | $602 | $8,640 | $1,670 | $6,970 |
| 2016 | $493 | $7,200 | $1,610 | $5,590 |
| 2015 | $485 | $7,200 | $1,610 | $5,590 |
| 2014 | $322 | $5,120 | $1,610 | $3,510 |
Source: Public Records
Map
Nearby Homes
- 1278 Wagon Rd
- 1288 Haystack Rd
- 1519 Haystack Rd
- 1311 Cement Creek Ave
- 1316 Owl Creek Ave
- 1512 Branding Iron Dr
- 1357 Fivemile Creek Ave
- 1364 Weminuche Ave
- 1422 Blue Creek Ave
- 1427 Blue Creek Ave
- 1432 Owl Creek Ave
- 901 6530 Rd Unit 3007
- 901 6530 Rd Unit 1100
- 901 6530 Rd Unit 1203
- 901 6530 Rd Unit 1504
- 901 6530 Rd Unit 3414
- 901 6530 Rd Unit 2836
- 901 6530 Rd Unit Space 1030
- 901 6530 Rd Unit 1600
- 901 6530 Rd Unit 1414
- 1423 Haystack Rd
- 1443 Haystack Rd
- 1413 Haystack Rd
- 1453 Haystack Rd
- 1430 Haystack Rd
- 1420 Haystack Rd
- 1102 Excelsior Creek Ave
- 0 Excelisor Unit 673539
- 1101 Excelsior Creek Ave
- 1403 Haystack Rd
- 1450 Haystack Rd
- 1463 Haystack Rd
- 1410 Haystack Rd
- 1110 Excelsior Creek Ave
- 1103 Fivemile Creek Ave
- 1103 Five Mile Creek Ave
- 1465 Pitchfork Rd
- 1455 Pitchfork Rd
- 1109 Excelsior Creek Ave
- 1475 Pitchfork Rd
Your Personal Tour Guide
Ask me questions while you tour the home.