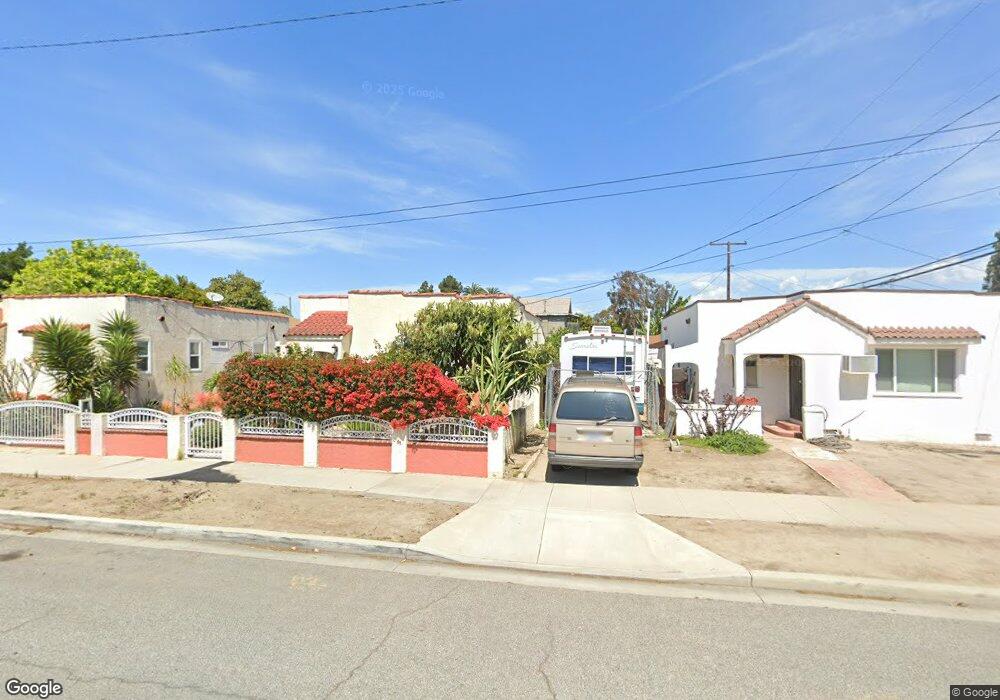
1433 W 25th St Long Beach, CA 90810
Westside NeighborhoodEstimated Value: $578,000 - $688,000
2
Beds
1
Bath
743
Sq Ft
$837/Sq Ft
Est. Value
About This Home
This home is located at 1433 W 25th St, Long Beach, CA 90810 and is currently estimated at $622,188, approximately $837 per square foot. 1433 W 25th St is a home located in Los Angeles County with nearby schools including Garfield Elementary School, Juan Rodriguez Cabrillo High School, and St. Lucy Catholic School.
Ownership History
Date
Name
Owned For
Owner Type
Purchase Details
Closed on
Jun 28, 2002
Sold by
Avila Arturo and Castro Rene A
Bought by
Giron Maria
Current Estimated Value
Home Financials for this Owner
Home Financials are based on the most recent Mortgage that was taken out on this home.
Original Mortgage
$124,000
Outstanding Balance
$52,566
Interest Rate
6.71%
Estimated Equity
$569,622
Purchase Details
Closed on
Feb 5, 1998
Sold by
Avila Arturo and Giron Maria
Bought by
Avila Arturo
Home Financials for this Owner
Home Financials are based on the most recent Mortgage that was taken out on this home.
Original Mortgage
$93,198
Interest Rate
7%
Mortgage Type
FHA
Purchase Details
Closed on
May 3, 1995
Sold by
Queen Beverly J and The Eighmy Family Living Trust
Bought by
Avila Arturo
Home Financials for this Owner
Home Financials are based on the most recent Mortgage that was taken out on this home.
Original Mortgage
$89,008
Interest Rate
7.71%
Mortgage Type
FHA
Create a Home Valuation Report for This Property
The Home Valuation Report is an in-depth analysis detailing your home's value as well as a comparison with similar homes in the area
Home Values in the Area
Average Home Value in this Area
Purchase History
| Date | Buyer | Sale Price | Title Company |
|---|---|---|---|
| Giron Maria | -- | Southland Title | |
| Avila Arturo | -- | American Title Co | |
| Avila Arturo | $89,500 | Continental Lawyers Title Co |
Source: Public Records
Mortgage History
| Date | Status | Borrower | Loan Amount |
|---|---|---|---|
| Open | Giron Maria | $124,000 | |
| Closed | Avila Arturo | $93,198 | |
| Previous Owner | Avila Arturo | $89,008 |
Source: Public Records
Tax History
| Year | Tax Paid | Tax Assessment Tax Assessment Total Assessment is a certain percentage of the fair market value that is determined by local assessors to be the total taxable value of land and additions on the property. | Land | Improvement |
|---|---|---|---|---|
| 2025 | $2,457 | $181,126 | $137,650 | $43,476 |
| 2024 | $2,457 | $177,575 | $134,951 | $42,624 |
| 2023 | $2,415 | $174,094 | $132,305 | $41,789 |
| 2022 | $2,272 | $170,681 | $129,711 | $40,970 |
| 2021 | $2,225 | $167,335 | $127,168 | $40,167 |
| 2019 | $2,194 | $162,375 | $123,398 | $38,977 |
| 2018 | $2,099 | $159,192 | $120,979 | $38,213 |
| 2016 | $1,932 | $153,012 | $116,282 | $36,730 |
| 2015 | $1,856 | $150,715 | $114,536 | $36,179 |
| 2014 | $1,850 | $147,764 | $112,293 | $35,471 |
Source: Public Records
Map
Nearby Homes
- 2835 Delta Ave
- 2673 Regway Ave
- 2033 W Burnett St
- 2911 Baltic Ave
- 2716 De Forest Ave
- 2941 Baltic Ave
- 2720 San Francisco Ave
- 2967 Canal Ave
- 2280 San Francisco Ave
- 2289 Golden Ave
- 2014 Easy Ave
- 2690 Oregon Ave
- 1410 W 20th St
- 2925 San Francisco Ave
- 2101 W Canton St
- 2871 Daisy Ave
- 2533 Eucalyptus Ave
- 864 W 31st St
- 3226 Caspian Ave
- 2905 Magnolia Ave
- 1441 W 25th St
- 1421 W 25th St
- 2516 Caspian Ave
- 2520 Caspian Ave
- 1442 W 25th St
- 2532 Caspian Ave
- 2509 Delta Ave
- 2515 Delta Ave
- 2472 Caspian Ave
- 2521 Delta Ave
- 2534 Caspian Ave
- 1400 W 25th St
- 2507 Caspian Ave
- 2501 Caspian Ave
- 2523 Delta Ave
- 2515 Caspian Ave
- 2464 Caspian Ave
- 2471 Delta Ave
- 2519 Caspian Ave
- 2540 Caspian Ave
Your Personal Tour Guide
Ask me questions while you tour the home.