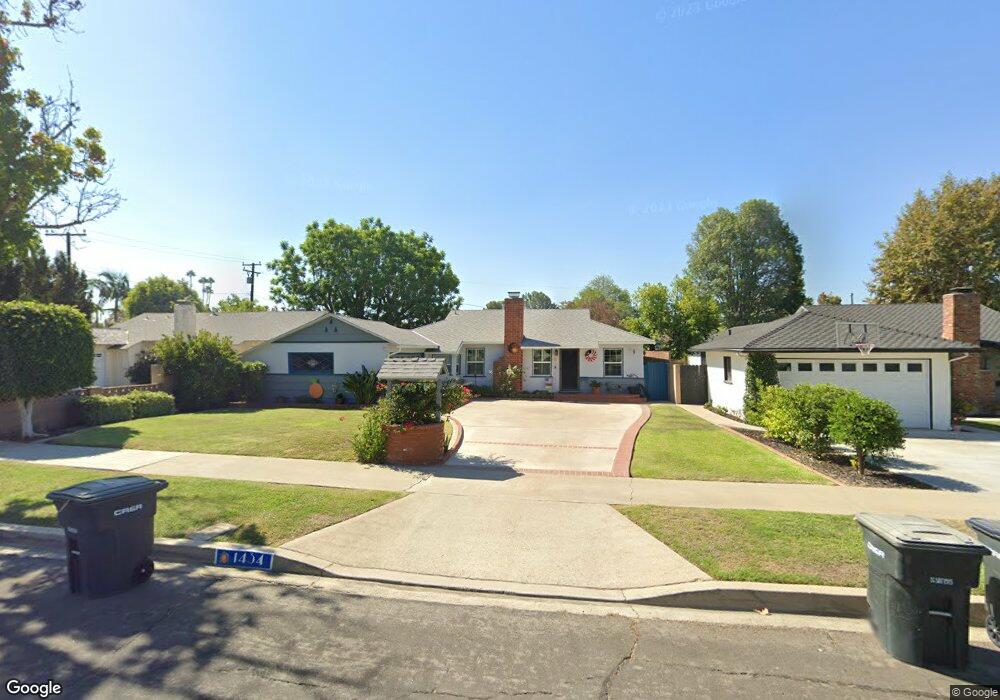
1434 E Maple Ave Orange, CA 92866
Estimated Value: $1,151,000 - $1,334,000
3
Beds
2
Baths
1,725
Sq Ft
$718/Sq Ft
Est. Value
About This Home
This home is located at 1434 E Maple Ave, Orange, CA 92866 and is currently estimated at $1,238,643, approximately $718 per square foot. 1434 E Maple Ave is a home located in Orange County with nearby schools including Cambridge Elementary School, Yorba Middle School, and Orange High School.
Ownership History
Date
Name
Owned For
Owner Type
Purchase Details
Closed on
May 12, 2015
Sold by
Dodson Arlene M
Bought by
Dodson Arlene M and The Arlene M Dodson Living Trust
Current Estimated Value
Purchase Details
Closed on
May 12, 2014
Sold by
Dodson Arlene
Bought by
Dodson Arlene Maria and John R Dodson & Arlene M Dodson Revocabl
Purchase Details
Closed on
Aug 6, 2001
Sold by
Dodson J Russell and Dodson Sheri
Bought by
Dodson J Russell and Dodson Arlene
Home Financials for this Owner
Home Financials are based on the most recent Mortgage that was taken out on this home.
Original Mortgage
$50,000
Outstanding Balance
$3,483
Interest Rate
7.19%
Mortgage Type
Credit Line Revolving
Estimated Equity
$1,235,160
Purchase Details
Closed on
Oct 11, 1993
Sold by
Dodson J Russell
Bought by
Dodson J Russell and Dodson Sheri
Home Financials for this Owner
Home Financials are based on the most recent Mortgage that was taken out on this home.
Original Mortgage
$185,000
Interest Rate
6.81%
Create a Home Valuation Report for This Property
The Home Valuation Report is an in-depth analysis detailing your home's value as well as a comparison with similar homes in the area
Home Values in the Area
Average Home Value in this Area
Purchase History
| Date | Buyer | Sale Price | Title Company |
|---|---|---|---|
| Dodson Arlene M | -- | None Available | |
| Dodson Arlene Maria | -- | None Available | |
| Dodson J Russell | -- | Chicago Title Co | |
| Dodson J Russell | -- | -- | |
| Dodson J Russell | -- | World Title Company |
Source: Public Records
Mortgage History
| Date | Status | Borrower | Loan Amount |
|---|---|---|---|
| Open | Dodson J Russell | $50,000 | |
| Closed | Dodson J Russell | $185,000 |
Source: Public Records
Tax History
| Year | Tax Paid | Tax Assessment Tax Assessment Total Assessment is a certain percentage of the fair market value that is determined by local assessors to be the total taxable value of land and additions on the property. | Land | Improvement |
|---|---|---|---|---|
| 2025 | $4,169 | $371,548 | $259,612 | $111,936 |
| 2024 | $4,169 | $364,263 | $254,521 | $109,742 |
| 2023 | $4,074 | $357,121 | $249,530 | $107,591 |
| 2022 | $3,992 | $350,119 | $244,637 | $105,482 |
| 2021 | $3,882 | $343,254 | $239,840 | $103,414 |
| 2020 | $3,919 | $339,735 | $237,381 | $102,354 |
| 2019 | $3,871 | $333,074 | $232,726 | $100,348 |
| 2018 | $3,813 | $326,544 | $228,163 | $98,381 |
| 2017 | $3,659 | $320,142 | $223,690 | $96,452 |
| 2016 | $3,589 | $313,865 | $219,304 | $94,561 |
| 2015 | $3,537 | $309,151 | $216,010 | $93,141 |
| 2014 | $3,390 | $303,096 | $211,779 | $91,317 |
Source: Public Records
Map
Nearby Homes
- 1514 E Palm Ave
- 1342 E Chapman Ave
- 1314 E Chapman Ave
- 178 N Monterey Rd
- 1243 E Almond Ave
- 365 N Magnolia St
- 255 N Waverly St
- 279 N Sacramento St
- 1409 E Orange Grove Ave
- 552 N Cambridge St
- 934 E Rose Ave
- 369 S Jennifer Ln
- 236 S Shaffer St
- 1201 E Fairway Dr
- 840 N Lynn Dr
- 354 E Culver Ave
- 1920 E Barkley Ave
- 2720 E Walnut Ave Unit 73
- 2705 E Orange Grove Ave
- 622 E Lomita Ave
- 1442 E Maple Ave
- 1424 E Maple Ave
- 1414 E Maple Ave
- 1433 E Lael Dr
- 1441 E Lael Dr
- 1423 E Lael Dr
- 1404 E Maple Ave
- 1413 E Lael Dr
- 186 N Shattuck Place
- 176 N Shattuck Place
- 1431 E Maple Ave
- 1441 E Maple Ave
- 1423 E Maple Ave
- 166 N Shattuck Place
- 1501 E Maple Ave
- 1403 E Lael Dr
- 1413 E Maple Ave
- 1342 E Maple Ave
- 156 N Shattuck Place
- 204 N Shattuck Place
Your Personal Tour Guide
Ask me questions while you tour the home.