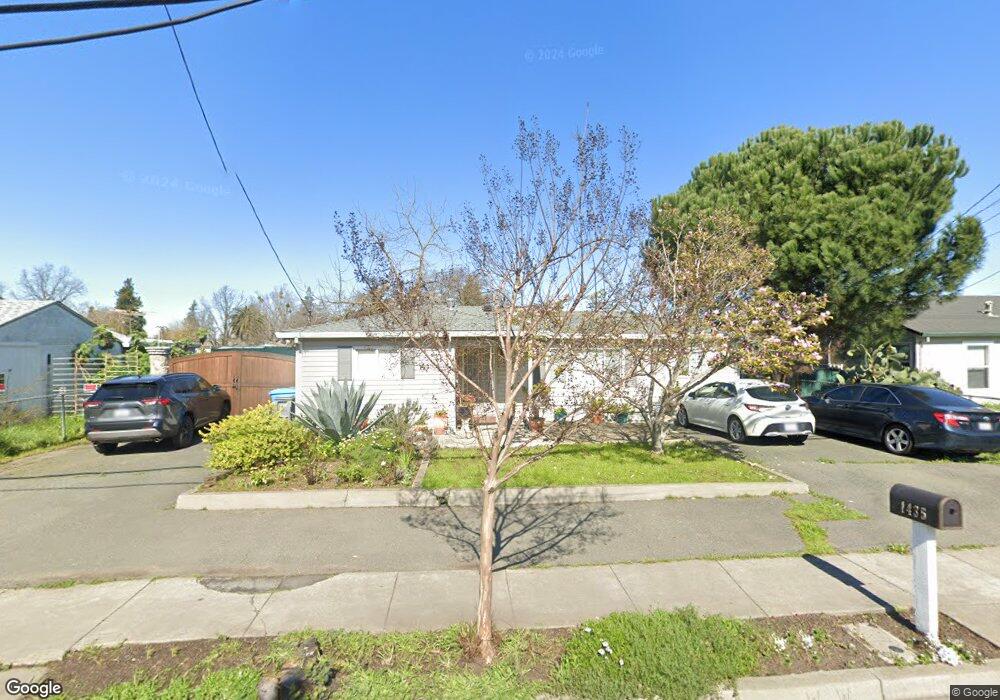
1435 Hearn Ave Santa Rosa, CA 95407
Estimated Value: $556,000 - $650,000
2
Beds
1
Bath
1,097
Sq Ft
$537/Sq Ft
Est. Value
About This Home
This home is located at 1435 Hearn Ave, Santa Rosa, CA 95407 and is currently estimated at $588,923, approximately $536 per square foot. 1435 Hearn Ave is a home located in Sonoma County with nearby schools including Elsie Allen High School and St. Michael's Orthodox School.
Ownership History
Date
Name
Owned For
Owner Type
Purchase Details
Closed on
Mar 28, 2011
Sold by
Speights Penelope L
Bought by
Tapia Maria S Paz
Current Estimated Value
Home Financials for this Owner
Home Financials are based on the most recent Mortgage that was taken out on this home.
Original Mortgage
$142,915
Outstanding Balance
$98,368
Interest Rate
4.75%
Mortgage Type
FHA
Estimated Equity
$490,555
Purchase Details
Closed on
Jun 1, 2009
Sold by
Gmac Mortgage Llc
Bought by
Speights Penelope L
Purchase Details
Closed on
Nov 4, 2008
Sold by
Torres Maria M and Torres Jose J
Bought by
Gmac Mortgage Llc and Gmac Mortgage Corporation
Purchase Details
Closed on
Sep 7, 2004
Sold by
Mendenhall Dwain H and Mendenhall Bennie E
Bought by
Torres Jose J and Torres Maria M
Home Financials for this Owner
Home Financials are based on the most recent Mortgage that was taken out on this home.
Original Mortgage
$306,800
Interest Rate
5.37%
Mortgage Type
Purchase Money Mortgage
Create a Home Valuation Report for This Property
The Home Valuation Report is an in-depth analysis detailing your home's value as well as a comparison with similar homes in the area
Home Values in the Area
Average Home Value in this Area
Purchase History
| Date | Buyer | Sale Price | Title Company |
|---|---|---|---|
| Tapia Maria S Paz | $150,000 | First American Title Company | |
| Speights Penelope L | $112,000 | First American Title Company | |
| Gmac Mortgage Llc | $196,920 | First American Title Company | |
| Torres Jose J | $383,500 | First American Title Co |
Source: Public Records
Mortgage History
| Date | Status | Borrower | Loan Amount |
|---|---|---|---|
| Open | Tapia Maria S Paz | $142,915 | |
| Previous Owner | Torres Jose J | $306,800 | |
| Closed | Torres Jose J | $76,700 |
Source: Public Records
Tax History Compared to Growth
Tax History
| Year | Tax Paid | Tax Assessment Tax Assessment Total Assessment is a certain percentage of the fair market value that is determined by local assessors to be the total taxable value of land and additions on the property. | Land | Improvement |
|---|---|---|---|---|
| 2025 | $3,611 | $192,162 | $128,110 | $64,052 |
| 2024 | $3,611 | $188,396 | $125,599 | $62,797 |
| 2023 | $3,611 | $184,703 | $123,137 | $61,566 |
| 2022 | $3,498 | $181,082 | $120,723 | $60,359 |
| 2021 | $3,430 | $177,532 | $118,356 | $59,176 |
| 2020 | $3,507 | $175,713 | $117,143 | $58,570 |
| 2019 | $3,264 | $172,269 | $114,847 | $57,422 |
| 2018 | $3,258 | $168,893 | $112,596 | $56,297 |
| 2017 | $2,933 | $165,583 | $110,389 | $55,194 |
| 2016 | $2,869 | $162,337 | $108,225 | $54,112 |
| 2015 | $2,776 | $159,900 | $106,600 | $53,300 |
| 2014 | $2,689 | $156,768 | $104,512 | $52,256 |
Source: Public Records
Map
Nearby Homes
- 1260 Aloise Ave
- 2721 Victoria Dr
- 2727 Victoria Dr
- 1630 Mathwig Dr
- 444 Pueblo Bonito Place
- 2632 Wild Bill Way
- 0 West Ave Unit 325019616
- 487 Hearn Ave
- 2630 Arrowhead Dr
- 2154 Corby Ave
- 2599 Silver Spur Dr
- 1953 Alamo Ln
- 1461 Trombetta St
- 1911 Corby Ave
- 1447 Beachwood Dr
- 2002 Marble St
- 2863 Liscum St
- 1521 Hughes Ave
- 2488 Giffen Ave
- 2716 Amora Cir