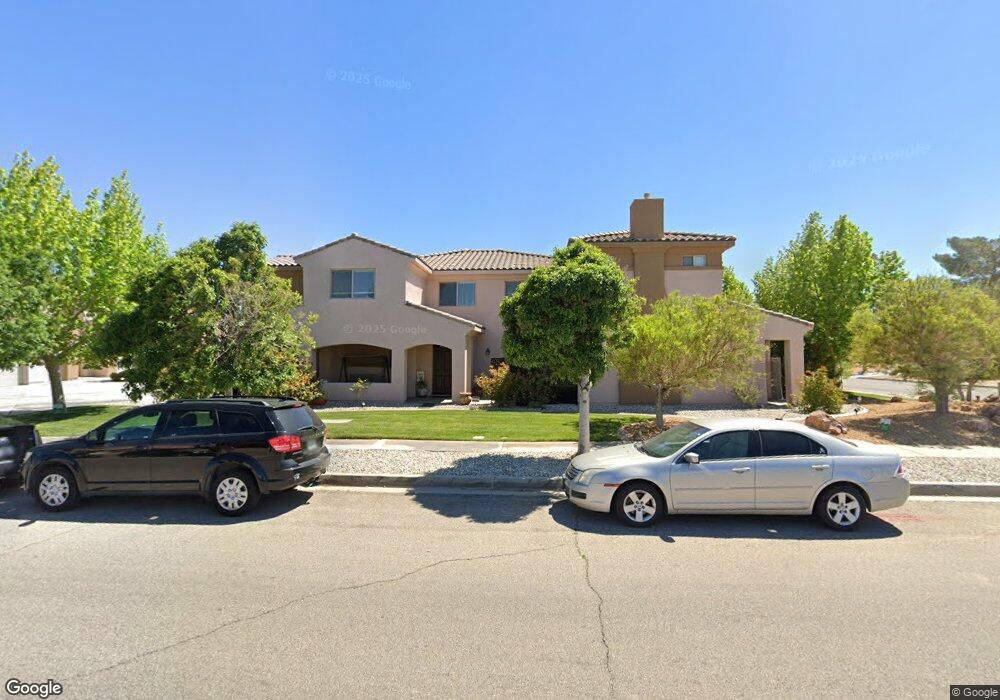
14355A Nautical Ln Unit 4 Helendale, CA 92342
Estimated Value: $329,000 - $435,000
3
Beds
3
Baths
2,389
Sq Ft
$159/Sq Ft
Est. Value
About This Home
This home is located at 14355A Nautical Ln Unit 4, Helendale, CA 92342 and is currently estimated at $379,108, approximately $158 per square foot. 14355A Nautical Ln Unit 4 is a home located in San Bernardino County with nearby schools including Helendale Elementary School, Riverview Middle School, and Adelanto High School.
Ownership History
Date
Name
Owned For
Owner Type
Purchase Details
Closed on
Mar 19, 2019
Sold by
Sullivan Kevin M
Bought by
Cook Gary L and Scott Cook Patricia L
Current Estimated Value
Home Financials for this Owner
Home Financials are based on the most recent Mortgage that was taken out on this home.
Original Mortgage
$215,897
Outstanding Balance
$189,033
Interest Rate
4.2%
Mortgage Type
VA
Estimated Equity
$190,075
Purchase Details
Closed on
May 11, 2017
Sold by
Grisamore Rhonda Lynn
Bought by
Sullivan Kevin M
Purchase Details
Closed on
Mar 9, 2017
Sold by
Linktech Investments Llc
Bought by
Sullivan Kevin M
Home Financials for this Owner
Home Financials are based on the most recent Mortgage that was taken out on this home.
Original Mortgage
$151,500
Interest Rate
5.62%
Mortgage Type
Adjustable Rate Mortgage/ARM
Purchase Details
Closed on
Apr 21, 2011
Sold by
Sequoia Financial Solutions Ii Llc
Bought by
Linktech Investments Llc
Create a Home Valuation Report for This Property
The Home Valuation Report is an in-depth analysis detailing your home's value as well as a comparison with similar homes in the area
Home Values in the Area
Average Home Value in this Area
Purchase History
| Date | Buyer | Sale Price | Title Company |
|---|---|---|---|
| Cook Gary L | $209,000 | First American Title | |
| Sullivan Kevin M | -- | First American Title Company | |
| Sullivan Kevin M | $202,000 | First American Title Company | |
| Linktech Investments Llc | $108,500 | Commerce Title Company |
Source: Public Records
Mortgage History
| Date | Status | Borrower | Loan Amount |
|---|---|---|---|
| Open | Cook Gary L | $215,897 | |
| Previous Owner | Sullivan Kevin M | $151,500 |
Source: Public Records
Tax History
| Year | Tax Paid | Tax Assessment Tax Assessment Total Assessment is a certain percentage of the fair market value that is determined by local assessors to be the total taxable value of land and additions on the property. | Land | Improvement |
|---|---|---|---|---|
| 2025 | $3,016 | $233,143 | $46,629 | $186,514 |
| 2024 | $2,809 | $228,572 | $45,715 | $182,857 |
| 2023 | $2,786 | $224,091 | $44,819 | $179,272 |
| 2022 | $2,747 | $219,697 | $43,940 | $175,757 |
| 2021 | $2,693 | $215,389 | $43,078 | $172,311 |
| 2020 | $2,640 | $213,180 | $42,636 | $170,544 |
| 2019 | $2,638 | $210,161 | $52,540 | $157,621 |
| 2018 | $2,759 | $206,040 | $51,510 | $154,530 |
| 2017 | $1,626 | $119,494 | $35,847 | $83,647 |
| 2016 | $1,606 | $117,151 | $35,144 | $82,007 |
| 2015 | $1,523 | $115,391 | $34,616 | $80,775 |
| 2014 | $1,534 | $113,131 | $33,938 | $79,193 |
Source: Public Records
Map
Nearby Homes
- 27506 Silver Lakes Pkwy
- 1 Silver Lakes Pkwy
- 14464 Jamaica Ln
- 14414 Ironsides Ln
- 27044 Pirateer Ln
- 0 Outrigger Ln Ca 92342 Ln
- 11496 Nautical Ln Unit 19
- 11496 Nautical Ln Unit 20
- 14473 Hurricane Ln
- 14336 Galleon Ln
- 14540 Lighthouse Ln
- 27452 Silver Lakes Pkwy
- 26938 Lakeview Dr
- 27004 Reef Ln
- 26826 Silver Lakes Pkwy
- 26709 Lakeview Dr
- 14602 Rivers Edge Rd
- 27539 Silver Lakes Pkwy
- 0 Rivers Edge Rd Unit HD25107159
- 27546 Silver Lakes Pkwy
- 14355 Nautical Ln Unit 6
- 14355 Nautical Ln Unit 5
- 14355 Nautical Ln Unit 4
- 14355 Nautical Ln Unit B
- 14355 Nautical Ln Unit A
- 14355 Nautical Ln Unit C
- 14355 Nautical Ln Unit 6
- 14355 Nautical Ln Unit 4
- 14355 Nautical Ln Unit 1-20
- 14355 Nautical Ln Unit 5
- 14355 Nautical Ln Unit 6
- 14355 Nautical Ln Unit C
- 14355 Nautical Ln Unit A
- 14355 Nautical Ln Unit B
- 14375 Nautical C (1) Ln Unit 1
- 14375B Nautical Ln Unit 2
- 14375 Nautical Ln Unit 2
- 14375 Nautical Ln Unit 1
- 14375 Nautical Ln Unit C
- 14375 Nautical Ln Unit A