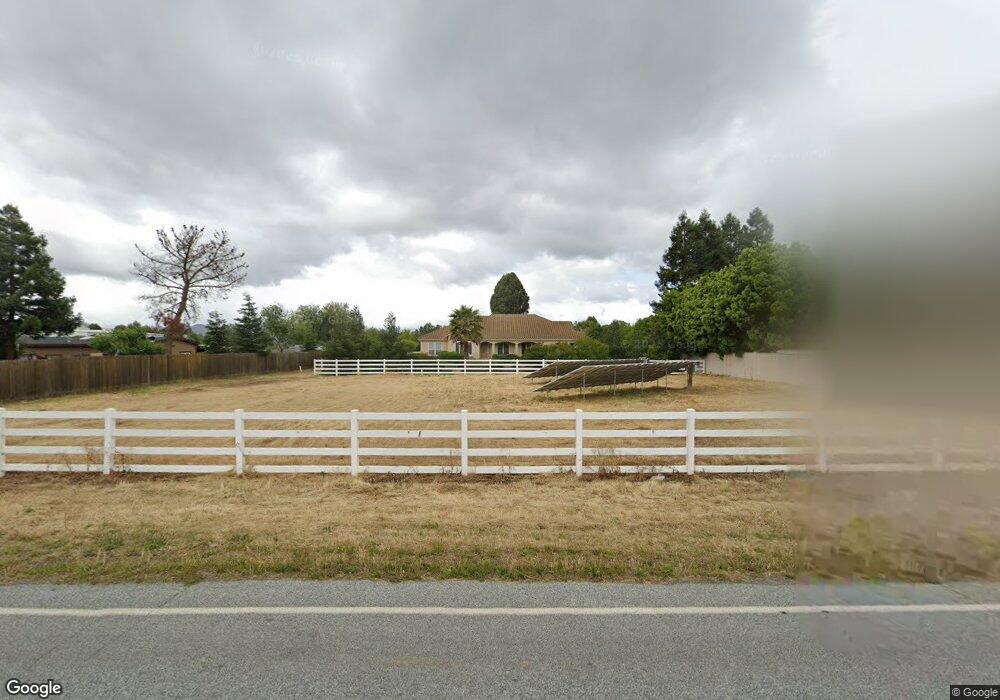
14359 Sycamore Ave San Martin, CA 95046
Estimated Value: $1,762,000 - $3,216,000
4
Beds
3
Baths
3,029
Sq Ft
$741/Sq Ft
Est. Value
About This Home
This home is located at 14359 Sycamore Ave, San Martin, CA 95046 and is currently estimated at $2,244,978, approximately $741 per square foot. 14359 Sycamore Ave is a home located in Santa Clara County with nearby schools including San Martin/Gwinn Environmental Science Academy, Britton Middle School, and Live Oak High School.
Ownership History
Date
Name
Owned For
Owner Type
Purchase Details
Closed on
Mar 26, 2020
Sold by
Berlinski Marsha L
Bought by
Berlinski Marsha L
Current Estimated Value
Purchase Details
Closed on
Sep 12, 2017
Sold by
Berlinski Marsha L
Bought by
Berlinski Marsha L
Purchase Details
Closed on
May 6, 2002
Sold by
Farmer Paul L and Farmer Janis M
Bought by
Berlinski Michael B and Berlinski Marsha L
Home Financials for this Owner
Home Financials are based on the most recent Mortgage that was taken out on this home.
Original Mortgage
$675,000
Outstanding Balance
$244,068
Interest Rate
4.9%
Mortgage Type
Purchase Money Mortgage
Estimated Equity
$2,000,910
Purchase Details
Closed on
Mar 30, 2001
Sold by
Farmer Paul L and Farmer Janis M
Bought by
Farmer Paul L and Farmer Janis M
Create a Home Valuation Report for This Property
The Home Valuation Report is an in-depth analysis detailing your home's value as well as a comparison with similar homes in the area
Home Values in the Area
Average Home Value in this Area
Purchase History
| Date | Buyer | Sale Price | Title Company |
|---|---|---|---|
| Berlinski Marsha L | -- | Chicago Title Company | |
| Berlinski Marsha L | -- | Chicago Title Company | |
| Berlinski Marsha L | -- | None Available | |
| Berlinski Michael B | $900,000 | First American Title Guarant | |
| Farmer Paul L | -- | -- |
Source: Public Records
Mortgage History
| Date | Status | Borrower | Loan Amount |
|---|---|---|---|
| Open | Berlinski Michael B | $675,000 |
Source: Public Records
Tax History Compared to Growth
Tax History
| Year | Tax Paid | Tax Assessment Tax Assessment Total Assessment is a certain percentage of the fair market value that is determined by local assessors to be the total taxable value of land and additions on the property. | Land | Improvement |
|---|---|---|---|---|
| 2025 | $15,484 | $1,380,447 | $664,778 | $715,669 |
| 2024 | $15,484 | $1,353,381 | $651,744 | $701,637 |
| 2023 | $15,285 | $1,326,845 | $638,965 | $687,880 |
| 2022 | $15,030 | $1,300,830 | $626,437 | $674,393 |
| 2021 | $14,654 | $1,275,324 | $614,154 | $661,170 |
| 2020 | $14,221 | $1,262,248 | $607,857 | $654,391 |
| 2019 | $14,625 | $1,237,499 | $595,939 | $641,560 |
| 2018 | $14,670 | $1,213,235 | $584,254 | $628,981 |
| 2017 | $14,532 | $1,189,448 | $572,799 | $616,649 |
| 2016 | $11,347 | $971,100 | $467,100 | $504,000 |
| 2015 | $10,273 | $874,900 | $421,300 | $453,600 |
| 2014 | $10,034 | $825,400 | $397,500 | $427,900 |
Source: Public Records
Map
Nearby Homes
- 14205 Sycamore Ave
- 13690 Murphy Ave #E
- 475 E Middle Ave
- 13755 Columbet Ave
- 13705 Sycamore Ave
- 13640 Sycamore Ave
- 0 Llagas Ave Unit ML82019140
- 14430 Monterey Hwy
- 905 E San Martin Ave
- 0 Seymour Ave Unit 225017465
- 14325 Monterey Rd
- 15465 Leann Ct
- 0 W San Martin Ave
- 0 Tennant Ave
- 15860 Hill Rd
- 15860 Hill Rd Unit A
- 12645 Harding Ave
- 14515 Shadowlane Ct
- 42 Dewey Cir
- 56 Creekside Dr Unit 56
- 14365 Sycamore Ave
- 14325 Sycamore Ave
- 14355 Sycamore Ave
- 14395 Sycamore Ave
- 14340 Sycamore Ave
- 14345 Sycamore Ave
- 14320 Sycamore Ave
- 14375 Sycamore Ave
- 14440 Sycamore Ave
- 14250 Sycamore Ave
- 14405 Sycamore Ave
- 14380 Sycamore Ave
- 14450 Sycamore Ave
- 880 E Middle Ave
- 14220 Sycamore Ave
- 14460 Sycamore Ave
- 1150 E Middle Ave
- 14200 Sycamore Ave
- 950 E Middle Ave
- 980 E Middle Ave