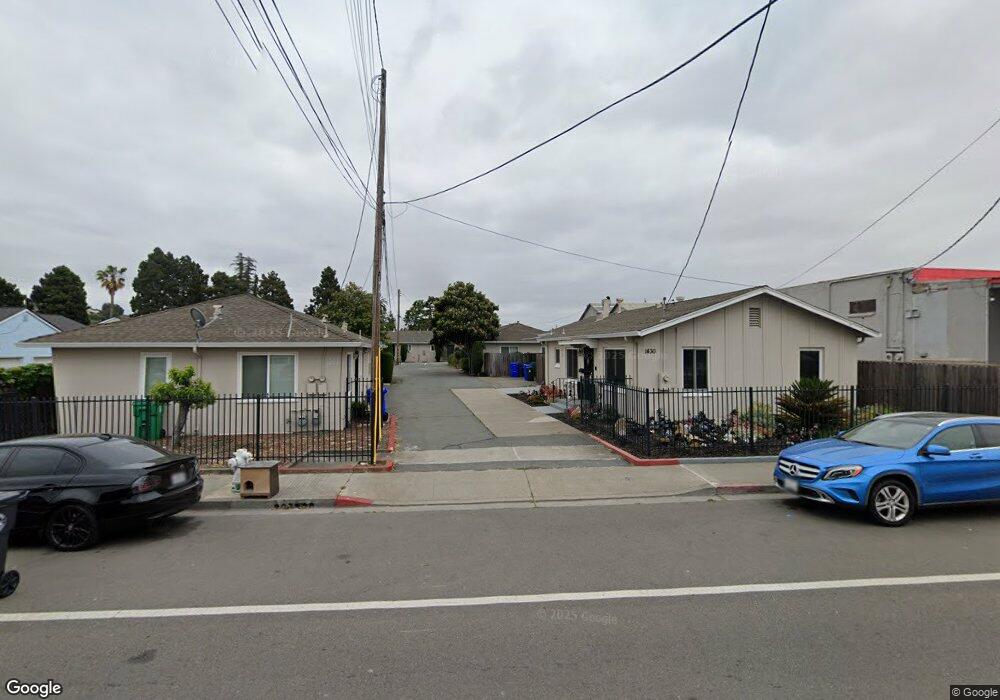
1438 167th Ave San Leandro, CA 94578
Estimated Value: $593,000 - $762,000
2
Beds
1
Bath
884
Sq Ft
$756/Sq Ft
Est. Value
About This Home
This home is located at 1438 167th Ave, San Leandro, CA 94578 and is currently estimated at $668,097, approximately $755 per square foot. 1438 167th Ave is a home located in Alameda County with nearby schools including Colonial Acres Elementary School, Edendale Middle, and San Lorenzo High School.
Ownership History
Date
Name
Owned For
Owner Type
Purchase Details
Closed on
Oct 27, 2010
Sold by
Wang Simon
Bought by
Deng Lily
Current Estimated Value
Purchase Details
Closed on
Oct 19, 2010
Sold by
Gmac Mortgage Llc
Bought by
Deng Yixun and Deng Lily
Purchase Details
Closed on
Jul 28, 2010
Sold by
Benetti Adam
Bought by
Gmac Mortgage Llc
Purchase Details
Closed on
Oct 31, 2006
Sold by
Benetti Adam S
Bought by
Benetti Adam
Home Financials for this Owner
Home Financials are based on the most recent Mortgage that was taken out on this home.
Original Mortgage
$150,000
Interest Rate
6.37%
Mortgage Type
Stand Alone Refi Refinance Of Original Loan
Purchase Details
Closed on
Jun 5, 2006
Sold by
167Th Avenue Lp
Bought by
Benetti Adam S
Create a Home Valuation Report for This Property
The Home Valuation Report is an in-depth analysis detailing your home's value as well as a comparison with similar homes in the area
Home Values in the Area
Average Home Value in this Area
Purchase History
| Date | Buyer | Sale Price | Title Company |
|---|---|---|---|
| Deng Lily | -- | Fidelity National Title Co | |
| Deng Yixun | -- | Fidelity National Title Co | |
| Deng Yixun | $101,000 | Fidelity National Title Co | |
| Gmac Mortgage Llc | $118,000 | Accommodation | |
| Benetti Adam | -- | Old Republic Title Company | |
| Benetti Adam S | -- | Old Republic Title Company |
Source: Public Records
Mortgage History
| Date | Status | Borrower | Loan Amount |
|---|---|---|---|
| Previous Owner | Benetti Adam | $150,000 |
Source: Public Records
Tax History Compared to Growth
Tax History
| Year | Tax Paid | Tax Assessment Tax Assessment Total Assessment is a certain percentage of the fair market value that is determined by local assessors to be the total taxable value of land and additions on the property. | Land | Improvement |
|---|---|---|---|---|
| 2025 | $2,711 | $129,390 | $38,817 | $90,573 |
| 2024 | $2,711 | $126,854 | $38,056 | $88,798 |
| 2023 | $2,470 | $124,367 | $37,310 | $87,057 |
| 2022 | $2,261 | $121,930 | $36,579 | $85,351 |
| 2021 | $2,190 | $119,538 | $35,861 | $83,677 |
| 2020 | $2,444 | $118,314 | $35,494 | $82,820 |
| 2019 | $2,550 | $115,994 | $34,798 | $81,196 |
| 2018 | $2,238 | $113,721 | $34,116 | $79,605 |
| 2017 | $2,030 | $111,492 | $33,447 | $78,045 |
| 2016 | $1,765 | $109,307 | $32,792 | $76,515 |
| 2015 | $1,724 | $107,665 | $32,299 | $75,366 |
| 2014 | $1,699 | $105,556 | $31,667 | $73,889 |
Source: Public Records
Map
Nearby Homes
- 16931 Melody Way
- 1510 165th Ave
- 16557 E 14th St
- 1560 170th Ave
- 1470 171st Ave
- 1615 167th Ave
- 1530 172nd Ave
- 1654 164th Ave
- 16960 Westerman Ct
- 920 Elgin St Unit G
- 16860 Robey Dr
- 16545 Hannah Dr
- 16543 Hannah Dr
- 17324 Ehle St
- 17220 Robey Dr
- 819 Delano St
- 0 Miramonte Corner Saratoga Unit 41091854
- 16829 Daryl Ave
- 1550 162nd Ave Unit 69
- 1550 162nd Ave Unit 47
- 1442 167th Ave Unit 1st
- 1442 167th Ave Unit 1442
- 1436 167th Ave Unit 1436
- 1434 167th Ave
- 1440 167th Ave
- 1456 167th Ave
- 1444 167th Ave
- 1430 167th Ave
- 1466 167th Ave
- 1423 168th Ave Unit 4
- 1423 168th Ave Unit 5
- 1427 168th Ave
- 1476 167th Ave
- 1431 168th Ave
- 1421 168th Ave
- 1415 168th Ave
- 1445 168th Ave
- 1486 167th Ave
- 16790 E 14th St
- 1496 167th Ave