Estimated Value: $390,147 - $462,000
3
Beds
2
Baths
1,248
Sq Ft
$336/Sq Ft
Est. Value
About This Home
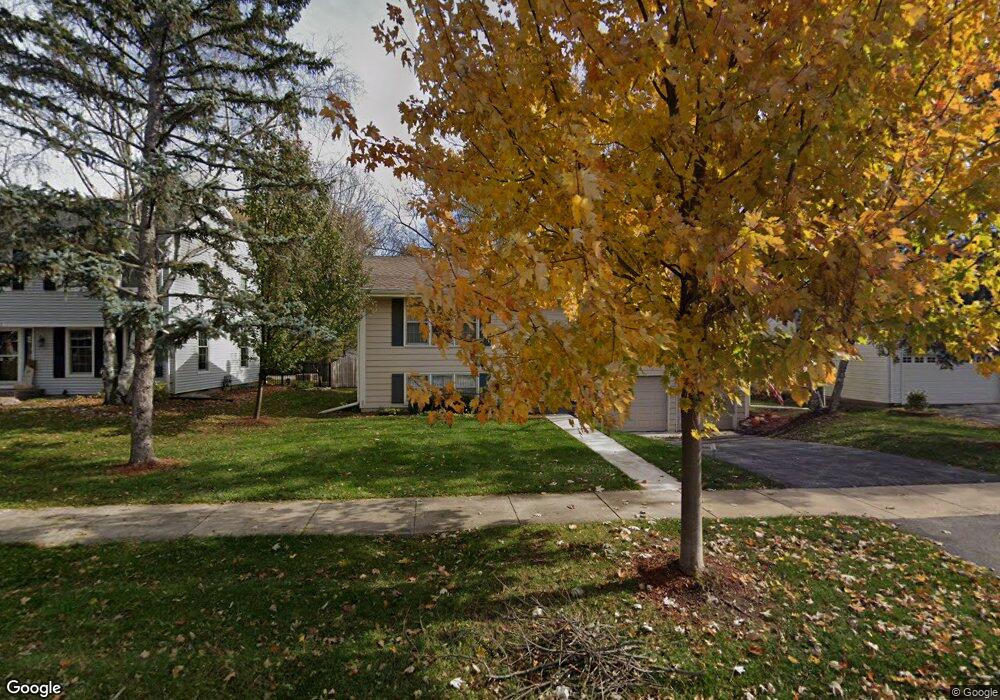
This home is located at 1438 7th Ct, Saint Charles, IL 60174 and is currently estimated at $418,787, approximately $335 per square foot. 1438 7th Ct is a home located in Kane County with nearby schools including Davis Primary School, Richmond Intermediate School, and Thompson Middle School.
Ownership History
Date
Name
Owned For
Owner Type
Purchase Details
Closed on
Nov 12, 2016
Sold by
Davis Robert S
Bought by
Davis Robert S and The Roberta S Davis Revocable
Current Estimated Value
Purchase Details
Closed on
Mar 29, 2016
Sold by
Davis Roberta Sue Stanford and Geraldine F Stanford Living Tr
Bought by
Davis Roberta S and Stanford Roberta S
Purchase Details
Closed on
May 6, 2015
Sold by
Stanford Geraldine F and Ralph H Stanford Living Trust
Bought by
Stanford Geraldine F and Geraldine F Stanford Living Tr
Purchase Details
Closed on
Jan 18, 2001
Sold by
Stanford Ralph H and Stanford Geraldine F
Bought by
Stanford Geraldine F and Standford Ralph H
Purchase Details
Closed on
Jan 17, 2001
Sold by
Stanford Ralph H and Stanford Geraldine F
Bought by
Stanford Ralph H and Stanford Geraldine F
Create a Home Valuation Report for This Property
The Home Valuation Report is an in-depth analysis detailing your home's value as well as a comparison with similar homes in the area
Home Values in the Area
Average Home Value in this Area
Purchase History
| Date | Buyer | Sale Price | Title Company |
|---|---|---|---|
| Davis Robert S | -- | None Available | |
| Davis Roberta S | -- | Chicago Title Insurance Co | |
| Stanford Geraldine F | -- | Chicago Title Insurance Co | |
| Stanford Geraldine F | -- | Chicago Title Insurance Co | |
| Stanford Ralph H | -- | Chicago Title Insurance Co | |
| Stanford Ralph H | -- | Chicago Title Insurance Co |
Source: Public Records
Tax History Compared to Growth
Tax History
| Year | Tax Paid | Tax Assessment Tax Assessment Total Assessment is a certain percentage of the fair market value that is determined by local assessors to be the total taxable value of land and additions on the property. | Land | Improvement |
|---|---|---|---|---|
| 2024 | $4,509 | $106,453 | $37,240 | $69,213 |
| 2023 | $4,862 | $95,277 | $33,330 | $61,947 |
| 2022 | $5,308 | $91,142 | $32,835 | $58,307 |
| 2021 | $5,362 | $86,876 | $31,298 | $55,578 |
| 2020 | $5,411 | $85,256 | $30,714 | $54,542 |
| 2019 | $5,989 | $83,568 | $30,106 | $53,462 |
| 2018 | $5,453 | $79,462 | $27,334 | $52,128 |
| 2017 | $5,509 | $76,745 | $26,399 | $50,346 |
| 2016 | $5,760 | $74,050 | $25,472 | $48,578 |
| 2015 | -- | $70,088 | $25,197 | $44,891 |
| 2014 | -- | $67,103 | $25,197 | $41,906 |
| 2013 | -- | $67,508 | $25,449 | $42,059 |
Source: Public Records
Map
Nearby Homes
- 806 Fellows St
- 629 N Lincoln Ave
- 1017 S 6th St
- 2749 Stone Cir
- 2753 Stone Cir
- 2747 Stone Cir
- 2751 Stone Cir
- 1028 S 5th St
- 82 Gray St
- 1326 Elm St
- 602 Highbury Ln
- 1108 S 12th St Unit 2
- 1336-1338 S 14th St
- 1330-1332 S 14th St
- 1008 Pine St
- 885 Geneva Rd
- Lot 1 Keller Place
- Lot 2 Geneva Rd
- Lot 1 Geneva Rd
- 1211 James St