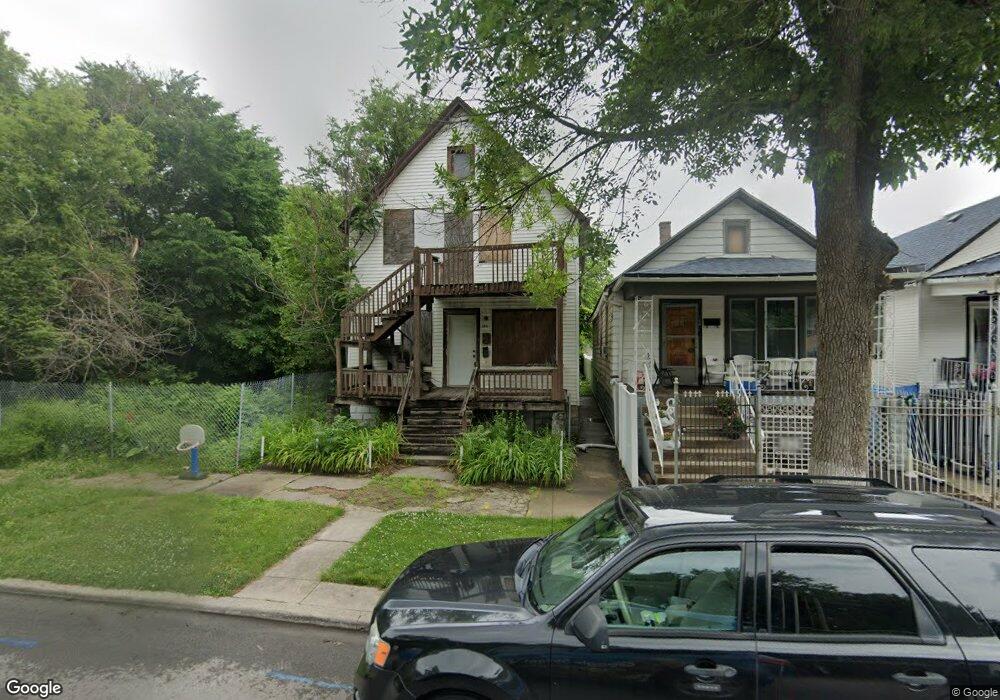
144 E 116th St Chicago, IL 60628
West Pullman NeighborhoodEstimated Value: $88,167 - $217,000
4
Beds
2
Baths
1,452
Sq Ft
$92/Sq Ft
Est. Value
About This Home
This home is located at 144 E 116th St, Chicago, IL 60628 and is currently estimated at $133,542, approximately $91 per square foot. 144 E 116th St is a home located in Cook County with nearby schools including Curtis Elementary School, Corliss High School, and CICS Prairie.
Ownership History
Date
Name
Owned For
Owner Type
Purchase Details
Closed on
Jul 12, 2023
Sold by
Yarbrough Karen A
Bought by
Cook County Land Bk Authority
Current Estimated Value
Purchase Details
Closed on
Nov 27, 2013
Sold by
Clay David Ten
Bought by
Evans Oliver
Purchase Details
Closed on
Apr 10, 2009
Sold by
Bank Of America National Association
Bought by
Clay David Ten
Purchase Details
Closed on
Sep 8, 2008
Sold by
Young Kallen Realty Services Inc
Bought by
Lasalle Bank Na and Washington Mutual Asset Backed Certifica
Purchase Details
Closed on
May 11, 2006
Sold by
Xez Inc
Bought by
Young Ashaunti
Home Financials for this Owner
Home Financials are based on the most recent Mortgage that was taken out on this home.
Original Mortgage
$148,000
Interest Rate
9.25%
Mortgage Type
Unknown
Purchase Details
Closed on
Jul 1, 2005
Sold by
Charleston Vernita
Bought by
Xez Inc
Purchase Details
Closed on
Apr 21, 2004
Sold by
Bell Annie G
Bought by
Roberts Evette
Create a Home Valuation Report for This Property
The Home Valuation Report is an in-depth analysis detailing your home's value as well as a comparison with similar homes in the area
Home Values in the Area
Average Home Value in this Area
Purchase History
| Date | Buyer | Sale Price | Title Company |
|---|---|---|---|
| Cook County Land Bk Authority | -- | None Listed On Document | |
| Evans Oliver | $1,500 | None Available | |
| Clay David Ten | $8,500 | Servicelink | |
| Lasalle Bank Na | -- | None Available | |
| Young Ashaunti | $185,000 | Alliance Title Company | |
| Xez Inc | $70,000 | Atg Search | |
| Roberts Evette | -- | -- |
Source: Public Records
Mortgage History
| Date | Status | Borrower | Loan Amount |
|---|---|---|---|
| Previous Owner | Young Ashaunti | $148,000 |
Source: Public Records
Tax History
| Year | Tax Paid | Tax Assessment Tax Assessment Total Assessment is a certain percentage of the fair market value that is determined by local assessors to be the total taxable value of land and additions on the property. | Land | Improvement |
|---|---|---|---|---|
| 2025 | $1,266 | -- | -- | -- |
| 2024 | $1,266 | $9,100 | $4,749 | $4,351 |
| 2023 | $1,235 | $5,987 | $4,774 | $1,213 |
| 2022 | $1,235 | $5,987 | $4,774 | $1,213 |
| 2021 | $1,207 | $5,985 | $4,773 | $1,212 |
| 2020 | $2,216 | $9,925 | $3,266 | $6,659 |
| 2019 | $2,221 | $11,028 | $3,266 | $7,762 |
| 2018 | $2,184 | $11,028 | $3,266 | $7,762 |
| 2017 | $1,661 | $7,701 | $3,015 | $4,686 |
| 2016 | $1,546 | $7,701 | $3,015 | $4,686 |
| 2015 | $1,415 | $7,701 | $3,015 | $4,686 |
| 2014 | $1,315 | $7,072 | $2,512 | $4,560 |
| 2013 | $1,289 | $7,072 | $2,512 | $4,560 |
Source: Public Records
Map
Nearby Homes
- 129 E Kensington Ave
- 11611 S Michigan Ave
- 321 E Kensington Ave
- 140 E 118th St
- 11735 S Indiana Ave
- 25 E 117th Place
- 119 E 118th St
- 344 E 117th St
- 11440 S Indiana Ave
- 11576 S State St
- 11548 S State St
- 11442 S Prairie Ave
- 11581 S Lafayette Ave
- 11709 S Lafayette Ave
- 11541 S Lafayette Ave
- 11833 S Indiana Ave
- 147 E 118th Place
- 16 E 118th Place
- 391 E Kensington Ave
- 11825 S State St
- 148 E 116th St
- 150 E 116th St
- 154 E 116th St
- 151 E 116th St
- 153 E 116th St
- 162 E 116th St
- 158 E 116th St
- 158 E 116th St
- 155 E 116th St
- 157 E 116th St
- 163 E 116th St
- 163 E 116th St
- 159 E 116th St
- 166 E 116th St
- 159 E Kensington Ave
- 165 E 116th St
- 157 E Kensington Ave
- 151 E Kensington Ave
- 200 E 116th St
- 163 E Kensington Ave
Your Personal Tour Guide
Ask me questions while you tour the home.