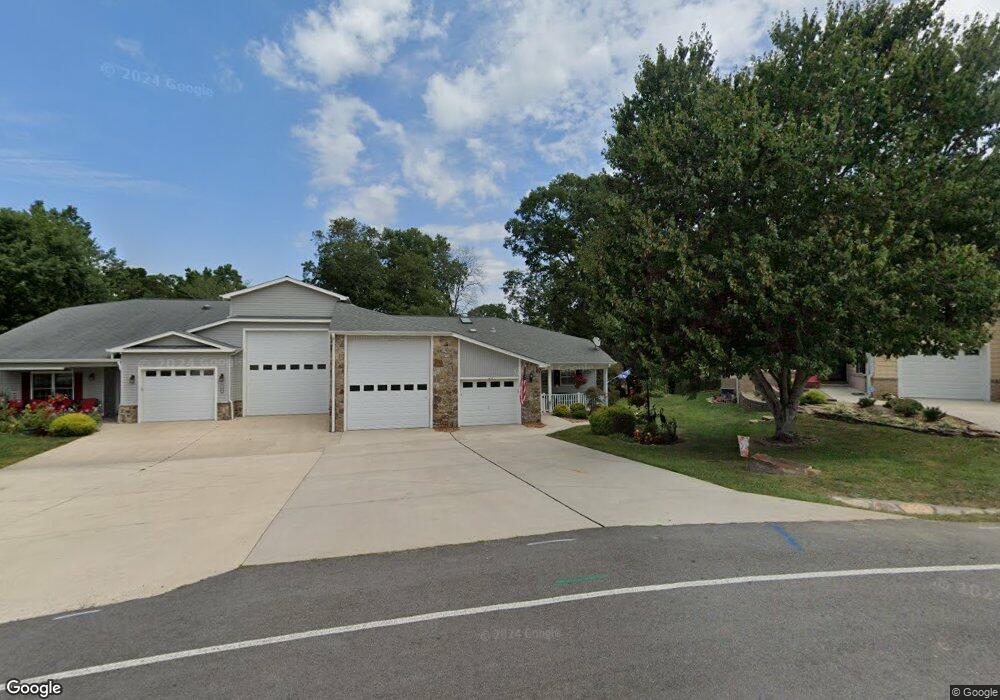
144 Our Way Loop Crossville, TN 38555
Estimated Value: $376,712 - $544,000
2
Beds
2
Baths
1,650
Sq Ft
$274/Sq Ft
Est. Value
About This Home
This home is located at 144 Our Way Loop, Crossville, TN 38555 and is currently estimated at $451,428, approximately $273 per square foot. 144 Our Way Loop is a home located in Cumberland County with nearby schools including Pleasant Hill Elementary School, Cumberland County High School, and Christian Academy of the Cumberlands.
Ownership History
Date
Name
Owned For
Owner Type
Purchase Details
Closed on
Dec 3, 2012
Sold by
Long Michael Winfield
Bought by
Kelly John L and Kelly Cathy K
Current Estimated Value
Home Financials for this Owner
Home Financials are based on the most recent Mortgage that was taken out on this home.
Original Mortgage
$202,364
Outstanding Balance
$140,601
Interest Rate
3.43%
Mortgage Type
VA
Estimated Equity
$310,827
Purchase Details
Closed on
Nov 9, 2005
Sold by
Burke Raymond J
Bought by
Long Michael Winfield
Home Financials for this Owner
Home Financials are based on the most recent Mortgage that was taken out on this home.
Original Mortgage
$120,144
Interest Rate
6%
Purchase Details
Closed on
May 14, 2004
Sold by
Mortensen Catherine T
Bought by
Burke Raymond J
Home Financials for this Owner
Home Financials are based on the most recent Mortgage that was taken out on this home.
Original Mortgage
$60,000
Interest Rate
5.88%
Purchase Details
Closed on
Aug 26, 1997
Sold by
Gardens Inc
Bought by
Mortensen Jerome L
Create a Home Valuation Report for This Property
The Home Valuation Report is an in-depth analysis detailing your home's value as well as a comparison with similar homes in the area
Home Values in the Area
Average Home Value in this Area
Purchase History
| Date | Buyer | Sale Price | Title Company |
|---|---|---|---|
| Kelly John L | $195,900 | -- | |
| Long Michael Winfield | $220,144 | -- | |
| Burke Raymond J | $164,000 | -- | |
| Mortensen Jerome L | $19,900 | -- |
Source: Public Records
Mortgage History
| Date | Status | Borrower | Loan Amount |
|---|---|---|---|
| Open | Kelly John L | $202,364 | |
| Previous Owner | Mortensen Jerome L | $120,144 | |
| Previous Owner | Mortensen Jerome L | $60,000 |
Source: Public Records
Tax History Compared to Growth
Tax History
| Year | Tax Paid | Tax Assessment Tax Assessment Total Assessment is a certain percentage of the fair market value that is determined by local assessors to be the total taxable value of land and additions on the property. | Land | Improvement |
|---|---|---|---|---|
| 2024 | $749 | $66,025 | $8,750 | $57,275 |
| 2023 | $749 | $66,025 | $0 | $0 |
| 2022 | $1,149 | $66,025 | $8,750 | $57,275 |
| 2021 | $1,032 | $44,575 | $8,750 | $35,825 |
| 2020 | $698 | $44,575 | $8,750 | $35,825 |
| 2019 | $961 | $44,575 | $8,750 | $35,825 |
| 2018 | $961 | $44,575 | $8,750 | $35,825 |
| 2017 | $961 | $44,575 | $8,750 | $35,825 |
| 2016 | $1,027 | $47,575 | $8,750 | $38,825 |
| 2015 | $1,012 | $47,575 | $8,750 | $38,825 |
| 2014 | $965 | $47,572 | $0 | $0 |
Source: Public Records
Map
Nearby Homes
- 78 Our Way Loop
- 27 Hickory Hollow Cir
- 76 Our Way Dr
- 1378 Sparta Hwy Unit 1378
- 36 White Oak Cir
- 150 Dillon St
- 1177 Sparta Hwy
- 122 Lee Cir
- 0 Sparta Hwy
- 88 acres Sparta Hwy
- 229 Hawthorn Loop
- 172 Hawthorn Loop
- 275 Hawthorn Loop
- 0 Dr
- 2 Riverchase Dr
- 4 Riverchase Dr
- 0.72 ac Waterview Dr
- 0 Waterview Dr Unit 1306982
- 0 Red Oak Dr Unit 1306752
- 0 Red Oak Dr Unit 1255165
- 146 Our Way Loop
- 132 Our Way Loop
- 126 Our Way Loop
- 150 Our Way Loop
- 123 Kings Row
- 107 Kings Row
- 141 Kings Row
- 185 Our Way Loop
- 116 Our Way Loop
- 164 Our Way Loop
- 95 Kings Row
- 112 Our Way Loop
- 163 Kings Row
- 119 Our Way Loop
- 166 Our Way Loop
- 111 Our Way Loop
- 69 Kings Row
- 92 Our Way Loop
- 190 Our Way Loop
- 181 Kings Row