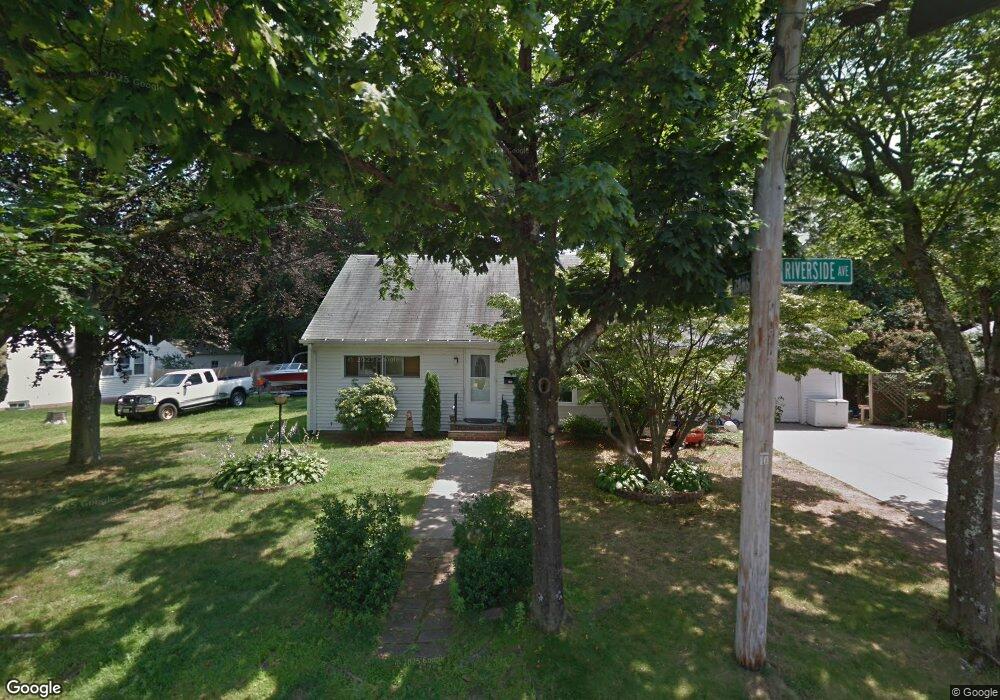
144 Riverside Ave Cranston, RI 02910
Eden Park NeighborhoodEstimated Value: $364,000 - $457,555
4
Beds
2
Baths
1,886
Sq Ft
$226/Sq Ft
Est. Value
About This Home
This home is located at 144 Riverside Ave, Cranston, RI 02910 and is currently estimated at $425,639, approximately $225 per square foot. 144 Riverside Ave is a home located in Providence County with nearby schools including Park View Middle School, Cranston High School East, and Cadence Academy Preschool - Cranston.
Ownership History
Date
Name
Owned For
Owner Type
Purchase Details
Closed on
Dec 21, 2007
Sold by
Carlos Carlos A and Philips Leah M
Bought by
Chhay Nary and Kim Sareth
Current Estimated Value
Home Financials for this Owner
Home Financials are based on the most recent Mortgage that was taken out on this home.
Original Mortgage
$170,000
Interest Rate
6.3%
Mortgage Type
Purchase Money Mortgage
Purchase Details
Closed on
Sep 25, 2002
Sold by
Loppi Francis H
Bought by
Carlos Carlos A and Phillips Leah
Purchase Details
Closed on
Oct 13, 1992
Sold by
Piascik Chester and Piascik Francine
Bought by
Loppi Ronald E and Loppi Elaine
Create a Home Valuation Report for This Property
The Home Valuation Report is an in-depth analysis detailing your home's value as well as a comparison with similar homes in the area
Home Values in the Area
Average Home Value in this Area
Purchase History
| Date | Buyer | Sale Price | Title Company |
|---|---|---|---|
| Chhay Nary | $157,500 | -- | |
| Carlos Carlos A | $175,000 | -- | |
| Loppi Ronald E | $114,000 | -- |
Source: Public Records
Mortgage History
| Date | Status | Borrower | Loan Amount |
|---|---|---|---|
| Open | Loppi Ronald E | $199,867 | |
| Closed | Loppi Ronald E | $212,250 | |
| Closed | Loppi Ronald E | $170,000 |
Source: Public Records
Tax History
| Year | Tax Paid | Tax Assessment Tax Assessment Total Assessment is a certain percentage of the fair market value that is determined by local assessors to be the total taxable value of land and additions on the property. | Land | Improvement |
|---|---|---|---|---|
| 2025 | $5,308 | $382,400 | $128,000 | $254,400 |
| 2024 | $5,204 | $382,400 | $128,000 | $254,400 |
| 2023 | $4,727 | $250,100 | $84,300 | $165,800 |
| 2022 | $4,629 | $250,100 | $84,300 | $165,800 |
| 2021 | $4,502 | $250,100 | $84,300 | $165,800 |
| 2020 | $4,420 | $212,800 | $80,300 | $132,500 |
| 2019 | $4,420 | $212,800 | $80,300 | $132,500 |
| 2018 | $4,318 | $212,800 | $80,300 | $132,500 |
| 2017 | $4,377 | $190,800 | $72,200 | $118,600 |
| 2016 | $4,129 | $183,900 | $72,200 | $111,700 |
| 2015 | $4,129 | $183,900 | $72,200 | $111,700 |
| 2014 | $4,063 | $177,900 | $72,200 | $105,700 |
Source: Public Records
Map
Nearby Homes
- 150 Riverside Ave
- 103 Harper Ave
- 167 Forest Ave
- 33 Hemlock Ave
- 64 Holburn Ave
- 47 Holburn Ave
- 10 Woburn St
- 10 Dale Ave
- 859 Pontiac Ave
- 123 Harrington Ave
- 0 Elmwood Ave
- 35 Welfare Ave
- 22 Phillips Ave
- 105 Fordson Ave
- 25 Sharon St Unit 2
- 129 1st Ave
- 27 Frederick St
- 80 Colonial Ave
- 65 Perkins Ave
- 144 Laurens St
Your Personal Tour Guide
Ask me questions while you tour the home.