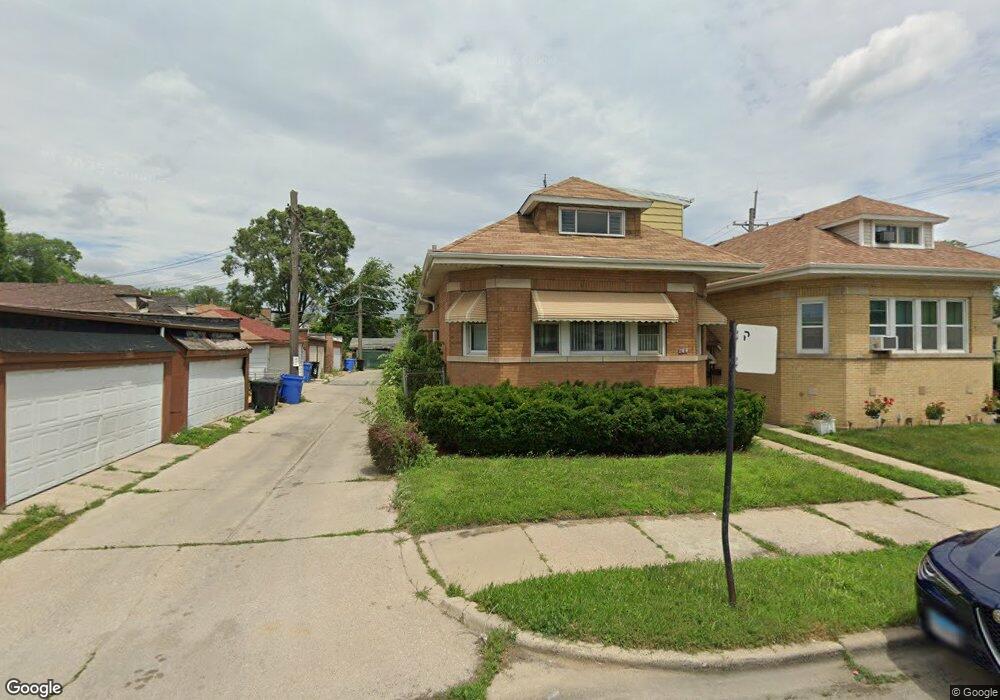
144 W 76th St Chicago, IL 60620
West Chatham NeighborhoodEstimated Value: $198,063 - $345,000
4
Beds
2
Baths
1,962
Sq Ft
$147/Sq Ft
Est. Value
About This Home
This home is located at 144 W 76th St, Chicago, IL 60620 and is currently estimated at $287,766, approximately $146 per square foot. 144 W 76th St is a home located in Cook County with nearby schools including Harvard Elementary School and Community Youth Development Institute.
Ownership History
Date
Name
Owned For
Owner Type
Purchase Details
Closed on
Sep 27, 2018
Sold by
Cdg Development Inc
Bought by
Adams Marshombe K
Current Estimated Value
Home Financials for this Owner
Home Financials are based on the most recent Mortgage that was taken out on this home.
Original Mortgage
$197,408
Outstanding Balance
$175,226
Interest Rate
5.75%
Mortgage Type
FHA
Estimated Equity
$112,540
Purchase Details
Closed on
Aug 4, 2015
Sold by
Chicago Title Land Trust Company
Bought by
Cdg Development Inc
Home Financials for this Owner
Home Financials are based on the most recent Mortgage that was taken out on this home.
Original Mortgage
$88,000
Interest Rate
4.08%
Mortgage Type
Construction
Purchase Details
Closed on
Sep 24, 2013
Sold by
Estate Of Jessie Mae Jones Webb Rogers
Bought by
Chicago Title Land Trust Co
Create a Home Valuation Report for This Property
The Home Valuation Report is an in-depth analysis detailing your home's value as well as a comparison with similar homes in the area
Home Values in the Area
Average Home Value in this Area
Purchase History
| Date | Buyer | Sale Price | Title Company |
|---|---|---|---|
| Adams Marshombe K | $183,000 | Chicago Title | |
| Cdg Development Inc | $45,000 | Cti | |
| Chicago Title Land Trust Co | $30,000 | None Available |
Source: Public Records
Mortgage History
| Date | Status | Borrower | Loan Amount |
|---|---|---|---|
| Open | Adams Marshombe K | $197,408 | |
| Previous Owner | Cdg Development Inc | $88,000 |
Source: Public Records
Tax History
| Year | Tax Paid | Tax Assessment Tax Assessment Total Assessment is a certain percentage of the fair market value that is determined by local assessors to be the total taxable value of land and additions on the property. | Land | Improvement |
|---|---|---|---|---|
| 2025 | $2,532 | $16,000 | $1,975 | $14,025 |
| 2024 | $2,532 | $16,000 | $1,975 | $14,025 |
| 2023 | $2,468 | $12,849 | $2,963 | $9,886 |
| 2022 | $2,468 | $12,849 | $2,963 | $9,886 |
| 2021 | $2,413 | $11,999 | $2,962 | $9,037 |
| 2020 | $3,426 | $15,381 | $2,962 | $12,419 |
| 2019 | $3,359 | $16,719 | $2,962 | $13,757 |
| 2018 | $2,624 | $16,719 | $2,962 | $13,757 |
| 2017 | $2,985 | $17,242 | $2,567 | $14,675 |
| 2016 | $2,953 | $17,242 | $2,567 | $14,675 |
| 2015 | $2,679 | $17,242 | $2,567 | $14,675 |
| 2014 | $2,452 | $15,782 | $2,370 | $13,412 |
| 2013 | $2,392 | $15,782 | $2,370 | $13,412 |
Source: Public Records
Map
Nearby Homes
- 7552 S Lafayette Ave
- 7435 S Wentworth Ave
- 7433 S Perry Ave
- 7431 S Perry Ave
- 7427 S Perry Ave
- 7425 S Perry Ave
- 143 W 74th St
- 318 W 75th St
- 7414 S Princeton Ave
- 7425 S Harvard Ave
- 7646 S Wabash Ave
- 7438 S Stewart Ave
- 7701 S Eggleston Ave
- 7414 S Stewart Ave
- 7628 S Eggleston Ave
- 7443 S Wabash Ave
- 7738 S Wabash Ave
- 7409 S Eggleston Ave
- 7621 S Normal Ave
- 7250 S Yale Ave
- 144 W 76th St
- 140 W 76th St
- 7553 S Wentworth Ave
- 7557 S Wentworth Ave Unit 2
- 7557 S Wentworth Ave
- 7549 S Wentworth Ave
- 7547 S Wentworth Ave
- 7558 S Perry Ave
- 7554 S Perry Ave
- 7550 S Perry Ave
- 7545 S Wentworth Ave
- 7548 S Perry Ave
- 145 W 76th St
- 143 W 76th St
- 7541 S Wentworth Ave
- 7542 S Perry Ave
- 139 W 76th St
- 7539 S Wentworth Ave
- 7538 S Perry Ave
- 7535 S Wentworth Ave
Your Personal Tour Guide
Ask me questions while you tour the home.