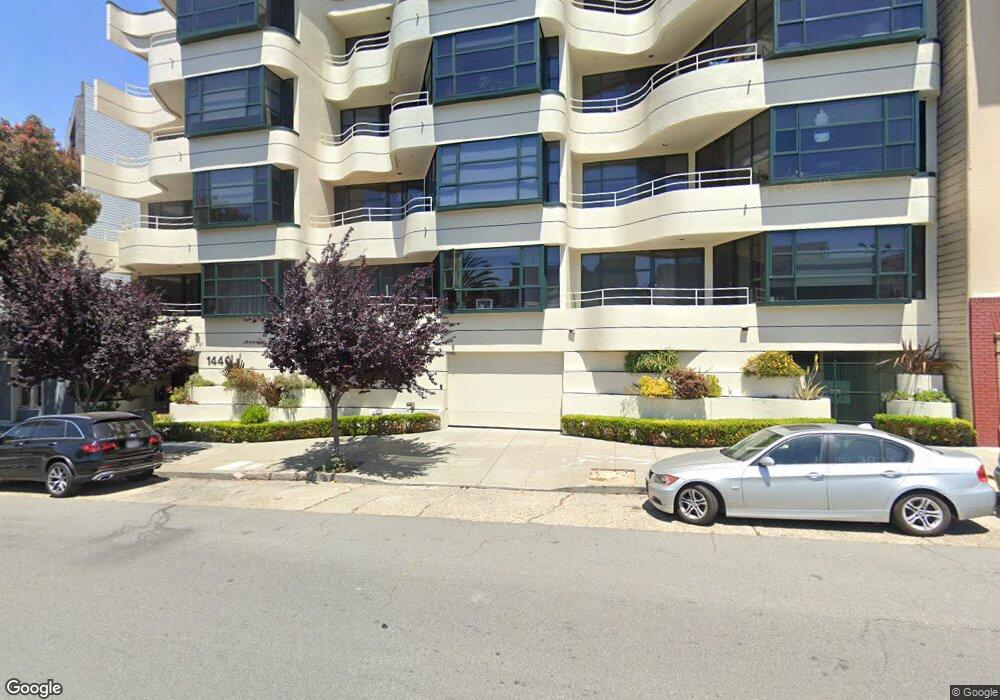
1440 Broadway Unit 306 San Francisco, CA 94109
Russian Hill NeighborhoodEstimated Value: $764,006 - $1,042,000
1
Bed
1
Bath
818
Sq Ft
$1,044/Sq Ft
Est. Value
About This Home
This home is located at 1440 Broadway Unit 306, San Francisco, CA 94109 and is currently estimated at $854,252, approximately $1,044 per square foot. 1440 Broadway Unit 306 is a home located in San Francisco County with nearby schools including Yick Wo Elementary School, Francisco Middle School, and Saint Brigid Academy.
Ownership History
Date
Name
Owned For
Owner Type
Purchase Details
Closed on
Sep 23, 2015
Sold by
Keefe Russell
Bought by
Singh Prabhnit and Kaur Harsheen
Current Estimated Value
Home Financials for this Owner
Home Financials are based on the most recent Mortgage that was taken out on this home.
Original Mortgage
$602,000
Outstanding Balance
$472,508
Interest Rate
3.89%
Mortgage Type
New Conventional
Estimated Equity
$381,744
Purchase Details
Closed on
Jul 18, 2012
Sold by
Keefe Russell G
Bought by
Keefe Russell
Purchase Details
Closed on
Feb 4, 2005
Sold by
Ottmann Properties Ltd
Bought by
Keefe Russell G
Home Financials for this Owner
Home Financials are based on the most recent Mortgage that was taken out on this home.
Original Mortgage
$432,000
Interest Rate
6.25%
Mortgage Type
Purchase Money Mortgage
Create a Home Valuation Report for This Property
The Home Valuation Report is an in-depth analysis detailing your home's value as well as a comparison with similar homes in the area
Home Values in the Area
Average Home Value in this Area
Purchase History
| Date | Buyer | Sale Price | Title Company |
|---|---|---|---|
| Singh Prabhnit | $758,000 | First American Title Company | |
| Keefe Russell | -- | None Available | |
| Keefe Russell G | $540,000 | Old Republic Title Company |
Source: Public Records
Mortgage History
| Date | Status | Borrower | Loan Amount |
|---|---|---|---|
| Open | Singh Prabhnit | $602,000 | |
| Previous Owner | Keefe Russell G | $108,000 | |
| Previous Owner | Keefe Russell G | $432,000 |
Source: Public Records
Tax History Compared to Growth
Tax History
| Year | Tax Paid | Tax Assessment Tax Assessment Total Assessment is a certain percentage of the fair market value that is determined by local assessors to be the total taxable value of land and additions on the property. | Land | Improvement |
|---|---|---|---|---|
| 2025 | $11,247 | $908,124 | $448,650 | $459,474 |
| 2024 | $11,247 | $890,320 | $439,854 | $450,466 |
| 2023 | $11,066 | $872,864 | $431,230 | $441,634 |
| 2022 | $10,846 | $855,752 | $422,776 | $432,976 |
| 2021 | $10,652 | $838,976 | $414,488 | $424,488 |
| 2020 | $10,641 | $820,476 | $410,238 | $410,238 |
| 2019 | $10,231 | $804,392 | $402,196 | $402,196 |
| 2018 | $9,888 | $788,620 | $394,310 | $394,310 |
| 2017 | $9,473 | $773,160 | $386,580 | $386,580 |
| 2016 | $9,308 | $758,000 | $379,000 | $379,000 |
| 2015 | $7,624 | $614,010 | $307,005 | $307,005 |
| 2014 | $7,425 | $601,984 | $300,992 | $300,992 |
Source: Public Records
Map
Nearby Homes
- 2145 Larkin St
- 1601 Pacific Ave Unit 207
- 1725 Hyde St Unit 1
- 1601 Hyde St
- 2160 Van Ness Ave
- 1728 Larkin St
- 1396 Pacific Ave Unit 1398
- 1519-1521 Jackson St
- 1754 Larkin St Unit 5
- 1567 Jackson St
- 74 Lynch St
- 1650 Jackson St Unit 707
- 68 Lynch St
- 1740 Larkin St
- 1438 Green St Unit 3D
- 1423-1427 Jackson St
- 44 Lynch St
- 1250 Vallejo St Unit 7
- 1250 Vallejo St Unit 9
- 1449 Hyde St Unit 5
- 1440 Broadway Unit 405
- 1440 Broadway Unit 402
- 1440 Broadway Unit 307
- 1440 Broadway Unit 303
- 1440 Broadway Unit 206
- 1440 Broadway Unit 203
- 1440 Broadway Unit 103
- 1440 Broadway Unit 202
- 1440 Broadway Unit 201
- 1440 Broadway Unit 107
- 1440 Broadway Unit 105
- 1440 Broadway Unit 104
- 1440 Broadway Unit 305
- 1440 Broadway Unit 304
- 1440 Broadway Unit 302
- 1440 Broadway Unit 301
- 1440 Broadway Unit 207
- 1440 Broadway Unit 205
- 1440 Broadway Unit 403
- 1440 Broadway Unit 401