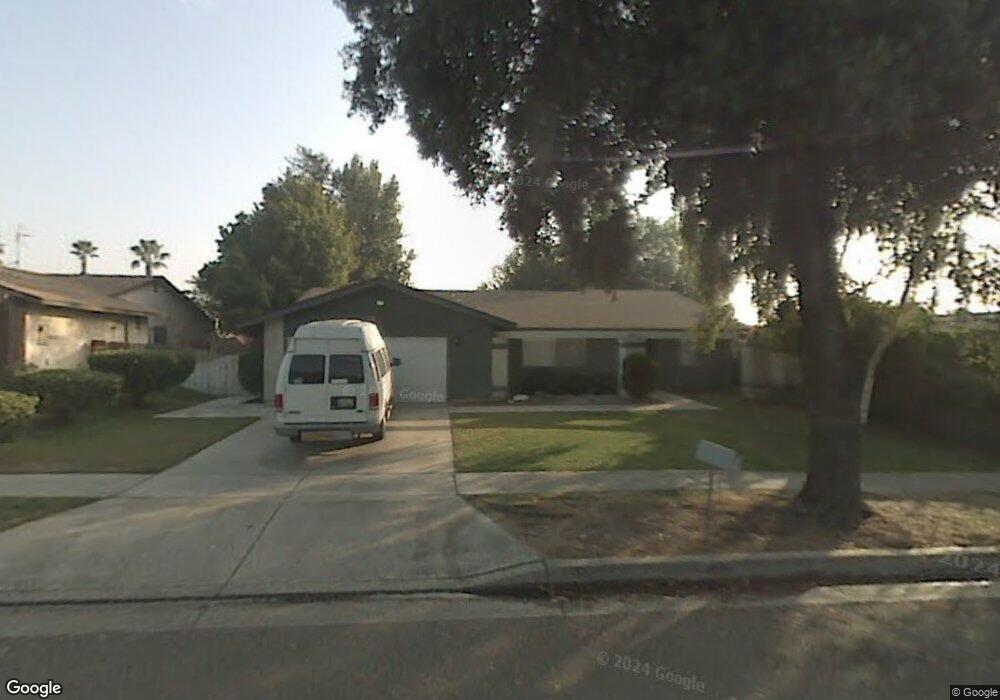
1440 Clock St Redlands, CA 92374
North Redlands NeighborhoodEstimated Value: $567,413 - $643,000
3
Beds
2
Baths
1,677
Sq Ft
$359/Sq Ft
Est. Value
About This Home
This home is located at 1440 Clock St, Redlands, CA 92374 and is currently estimated at $601,353, approximately $358 per square foot. 1440 Clock St is a home located in San Bernardino County with nearby schools including Judson & Brown Elementary School, Clement Middle School, and Redlands East Valley High School.
Ownership History
Date
Name
Owned For
Owner Type
Purchase Details
Closed on
Jan 21, 2014
Sold by
Jackson Kathleen M and Jackson Dennis L
Bought by
Jackson Kathleen M and The Lot 30 Trust
Current Estimated Value
Home Financials for this Owner
Home Financials are based on the most recent Mortgage that was taken out on this home.
Original Mortgage
$198,750
Interest Rate
4.46%
Mortgage Type
New Conventional
Purchase Details
Closed on
Mar 24, 2009
Sold by
Jackson Kathleen M
Bought by
Jackson Kathleen M and Lot 30 Trust
Purchase Details
Closed on
Dec 18, 1997
Sold by
Jackson Kathleen M
Bought by
Jackson Kathleen M and Family Trust Of Kathleen M Jac
Purchase Details
Closed on
Jul 28, 1997
Sold by
Jackson Dennis L and Jackson Kathleen M
Bought by
Jackson Dennis Lynn and Jackson Kathleen Mary
Home Financials for this Owner
Home Financials are based on the most recent Mortgage that was taken out on this home.
Original Mortgage
$98,800
Interest Rate
7.58%
Create a Home Valuation Report for This Property
The Home Valuation Report is an in-depth analysis detailing your home's value as well as a comparison with similar homes in the area
Home Values in the Area
Average Home Value in this Area
Purchase History
| Date | Buyer | Sale Price | Title Company |
|---|---|---|---|
| Jackson Kathleen M | -- | Accommodation | |
| Jackson Kathleen M | -- | Ticor Title Company | |
| Jackson Kathleen M | -- | None Available | |
| Jackson Kathleen M | -- | -- | |
| Jackson Dennis Lynn | -- | Old Republic Title Company |
Source: Public Records
Mortgage History
| Date | Status | Borrower | Loan Amount |
|---|---|---|---|
| Closed | Jackson Kathleen M | $198,750 | |
| Closed | Jackson Dennis Lynn | $98,800 |
Source: Public Records
Tax History
| Year | Tax Paid | Tax Assessment Tax Assessment Total Assessment is a certain percentage of the fair market value that is determined by local assessors to be the total taxable value of land and additions on the property. | Land | Improvement |
|---|---|---|---|---|
| 2025 | $4,247 | $340,395 | $94,530 | $245,865 |
| 2024 | $3,966 | $333,720 | $92,676 | $241,044 |
| 2023 | $3,961 | $327,177 | $90,859 | $236,318 |
| 2022 | $3,904 | $320,761 | $89,077 | $231,684 |
| 2021 | $3,975 | $314,471 | $87,330 | $227,141 |
| 2020 | $3,916 | $311,247 | $86,435 | $224,812 |
| 2019 | $3,807 | $305,144 | $84,740 | $220,404 |
| 2018 | $2,572 | $206,160 | $48,507 | $157,653 |
| 2017 | $2,551 | $202,118 | $47,556 | $154,562 |
| 2016 | $2,522 | $198,155 | $46,624 | $151,531 |
| 2015 | $2,504 | $195,179 | $45,924 | $149,255 |
| 2014 | $2,459 | $191,355 | $45,024 | $146,331 |
Source: Public Records
Map
Nearby Homes
- 917 Renee St
- 936 Judson St
- 1326 Campus Ave
- 1322 Campus Ave
- 450 Judson St Unit 94
- 455 Judson St Unit 9
- 927 Knightsbridge Ln
- 0 E Lugonia Ave
- 259 East Dr
- 15 Naomi St
- 1580 Lisa Ln
- 1575 Christopher Ln
- 0 E Colton Ave
- 1317 Susan Ave
- 1721 E Colton Ave Unit 33
- 1721 E Colton Ave Unit 115
- 1251 E Lugonia Ave Unit 109
- 1251 E Lugonia Ave Unit 27
- 1251 E Lugonia Ave Unit 24
- 1251 E Lugonia Ave Unit 18
Your Personal Tour Guide
Ask me questions while you tour the home.