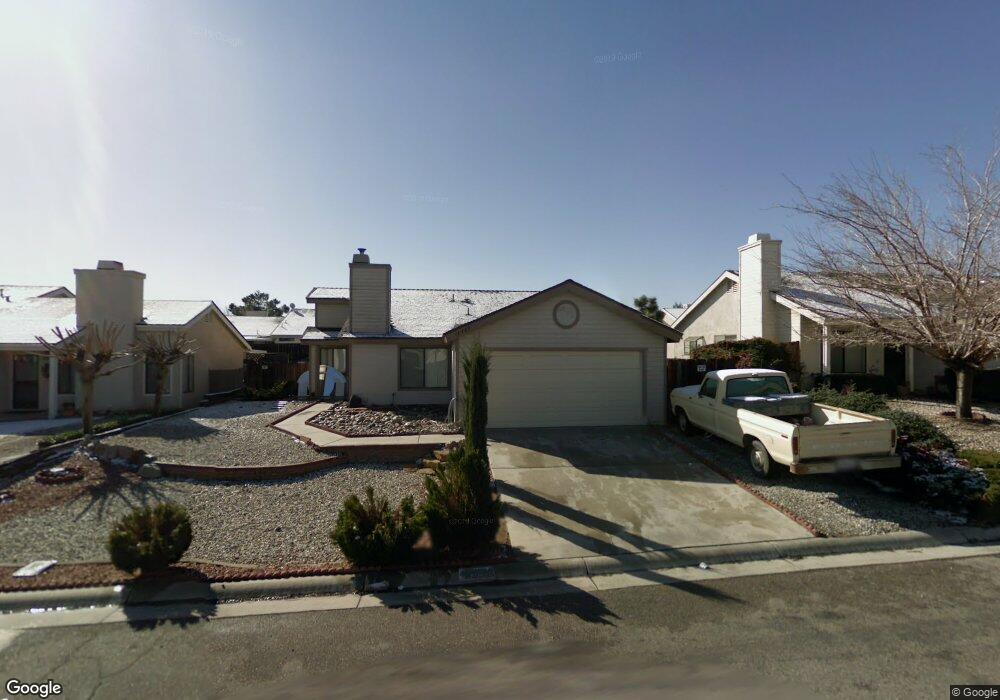
14409 Poplar St Hesperia, CA 92344
High Country NeighborhoodEstimated Value: $359,000 - $381,097
3
Beds
2
Baths
1,159
Sq Ft
$321/Sq Ft
Est. Value
About This Home
This home is located at 14409 Poplar St, Hesperia, CA 92344 and is currently estimated at $372,274, approximately $321 per square foot. 14409 Poplar St is a home located in San Bernardino County with nearby schools including Cottonwood Elementary School, Cedar Middle School, and Oak Hills High School.
Ownership History
Date
Name
Owned For
Owner Type
Purchase Details
Closed on
Nov 12, 2021
Sold by
Espinola Martha
Bought by
Espinola Martha and Espinola Patrick Ruben
Current Estimated Value
Purchase Details
Closed on
Mar 6, 2005
Sold by
Espinola Martha
Bought by
Espinola Martha
Home Financials for this Owner
Home Financials are based on the most recent Mortgage that was taken out on this home.
Original Mortgage
$80,000
Interest Rate
5.7%
Mortgage Type
New Conventional
Purchase Details
Closed on
Jun 16, 1996
Sold by
Hud
Bought by
Espinola Patrick and Espinola Martha
Home Financials for this Owner
Home Financials are based on the most recent Mortgage that was taken out on this home.
Original Mortgage
$62,883
Interest Rate
8.03%
Mortgage Type
FHA
Purchase Details
Closed on
Jun 1, 1995
Sold by
Pnc Bank Na
Bought by
Hud
Purchase Details
Closed on
May 26, 1995
Sold by
Curtis Brian
Bought by
Pnc Bank Na
Create a Home Valuation Report for This Property
The Home Valuation Report is an in-depth analysis detailing your home's value as well as a comparison with similar homes in the area
Home Values in the Area
Average Home Value in this Area
Purchase History
| Date | Buyer | Sale Price | Title Company |
|---|---|---|---|
| Espinola Martha | -- | None Listed On Document | |
| Espinola Martha | -- | United Title Los Angeles | |
| Espinola Patrick | $62,500 | United Title | |
| Hud | -- | First Southwestern Title Co | |
| Pnc Bank Na | $76,214 | First Southwestern Title Co |
Source: Public Records
Mortgage History
| Date | Status | Borrower | Loan Amount |
|---|---|---|---|
| Previous Owner | Espinola Martha | $80,000 | |
| Previous Owner | Espinola Patrick | $62,883 |
Source: Public Records
Tax History Compared to Growth
Tax History
| Year | Tax Paid | Tax Assessment Tax Assessment Total Assessment is a certain percentage of the fair market value that is determined by local assessors to be the total taxable value of land and additions on the property. | Land | Improvement |
|---|---|---|---|---|
| 2025 | $1,151 | $107,640 | $25,281 | $82,359 |
| 2024 | $1,151 | $105,529 | $24,785 | $80,744 |
| 2023 | $1,137 | $103,460 | $24,299 | $79,161 |
| 2022 | $1,111 | $101,432 | $23,823 | $77,609 |
| 2021 | $1,090 | $99,443 | $23,356 | $76,087 |
| 2020 | $1,077 | $98,424 | $23,117 | $75,307 |
| 2019 | $1,054 | $96,494 | $22,664 | $73,830 |
| 2018 | $1,033 | $94,602 | $22,220 | $72,382 |
| 2017 | $1,014 | $92,747 | $21,784 | $70,963 |
| 2016 | $992 | $90,929 | $21,357 | $69,572 |
| 2015 | $979 | $89,563 | $21,036 | $68,527 |
| 2014 | $965 | $87,809 | $20,624 | $67,185 |
Source: Public Records
Map
Nearby Homes
- 0 Tamarisk Ave Unit HD23052637
- 14572 Sultana St
- 8792 Newcastle Ave
- 14122 Hartford St
- 14110 Hartford St
- 14415 Hartford St
- 8843 Newcastle Ave
- Agate Plan at Seasons at Topaz
- 8800 Newcastle Ave
- 14191 Hartford St
- 8863 Glencliff Ave
- Ammolite HX Plan at Seasons at Topaz
- 14131 Desert Rose St
- 14145 Hartford St
- 9143 Ocotillo Ave
- 8846 Tamarisk Ave
- 14148 Hartford St
- 14073 Ruby St
- 0 Olive St
- 9454 Apricot Ct
- 14421 Poplar St
- 14397 Poplar St
- 14410 Birchwood Dr
- 14422 Birchwood Dr
- 14423 Poplar St
- 14395 Poplar St
- 9154 Cherrywood Ln
- 14398 Birchwood Dr
- 9153 Applewood Ln
- 14424 Birchwood Dr
- 14396 Birchwood Dr
- 14435 Poplar St
- 14383 Poplar St
- 9166 Cherrywood Ln
- 14436 Birchwood Dr
- 9165 Applewood Ln
- 9155 Cherrywood Ln
- 14384 Birchwood Dr
- 14447 Poplar St
- 9152 Applewood Ln