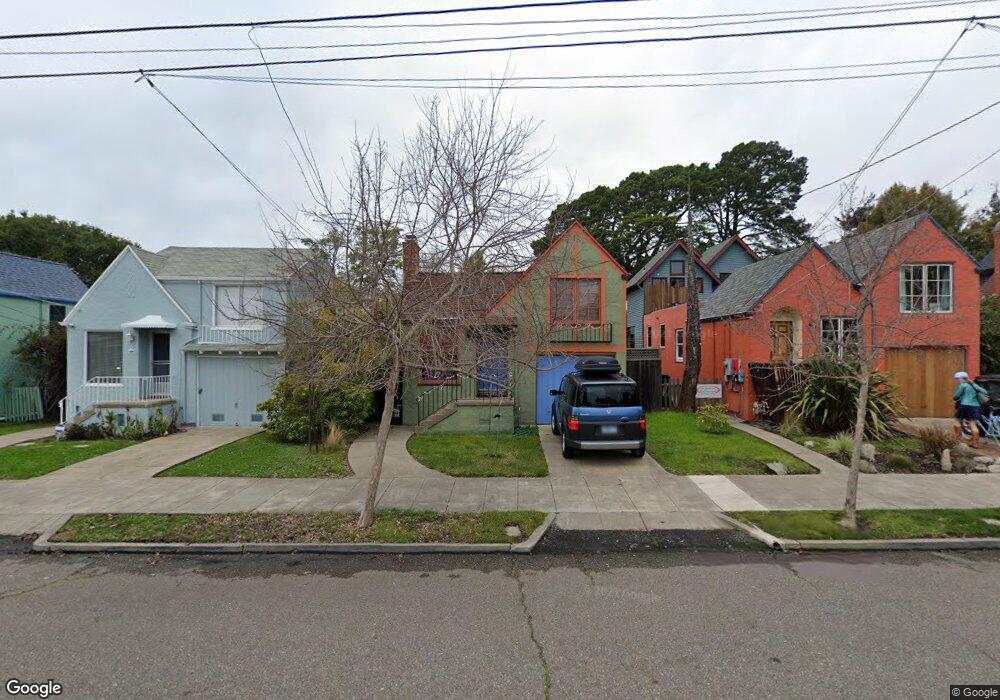
1441 Blake St Berkeley, CA 94702
West Berkeley NeighborhoodEstimated Value: $984,000 - $1,072,000
2
Beds
1
Bath
968
Sq Ft
$1,060/Sq Ft
Est. Value
About This Home
This home is located at 1441 Blake St, Berkeley, CA 94702 and is currently estimated at $1,026,378, approximately $1,060 per square foot. 1441 Blake St is a home located in Alameda County with nearby schools including Washington Elementary School, Oxford Elementary School, and Malcolm X Elementary School.
Ownership History
Date
Name
Owned For
Owner Type
Purchase Details
Closed on
Dec 18, 1998
Sold by
Sus Wright Rhonda M and Sus Charles A Taylor
Bought by
Bottum Angela L and Hamm Marjorie E
Current Estimated Value
Home Financials for this Owner
Home Financials are based on the most recent Mortgage that was taken out on this home.
Original Mortgage
$175,200
Outstanding Balance
$40,243
Interest Rate
6.91%
Estimated Equity
$986,135
Create a Home Valuation Report for This Property
The Home Valuation Report is an in-depth analysis detailing your home's value as well as a comparison with similar homes in the area
Home Values in the Area
Average Home Value in this Area
Purchase History
| Date | Buyer | Sale Price | Title Company |
|---|---|---|---|
| Bottum Angela L | $219,000 | First California Title Compa |
Source: Public Records
Mortgage History
| Date | Status | Borrower | Loan Amount |
|---|---|---|---|
| Open | Bottum Angela L | $175,200 | |
| Closed | Bottum Angela L | $21,900 |
Source: Public Records
Tax History
| Year | Tax Paid | Tax Assessment Tax Assessment Total Assessment is a certain percentage of the fair market value that is determined by local assessors to be the total taxable value of land and additions on the property. | Land | Improvement |
|---|---|---|---|---|
| 2025 | $5,640 | $306,523 | $94,057 | $219,466 |
| 2024 | $5,640 | $300,377 | $92,213 | $215,164 |
| 2023 | $5,511 | $301,351 | $90,405 | $210,946 |
| 2022 | $5,390 | $288,443 | $88,633 | $206,810 |
| 2021 | $5,385 | $282,651 | $86,895 | $202,756 |
| 2020 | $5,061 | $286,681 | $86,004 | $200,677 |
| 2019 | $4,819 | $281,061 | $84,318 | $196,743 |
| 2018 | $4,724 | $275,551 | $82,665 | $192,886 |
| 2017 | $4,531 | $270,150 | $81,045 | $189,105 |
| 2016 | $4,351 | $264,853 | $79,456 | $185,397 |
| 2015 | $4,287 | $260,875 | $78,262 | $182,613 |
| 2014 | $4,245 | $255,765 | $76,729 | $179,036 |
Source: Public Records
Map
Nearby Homes
- 2350 Sacramento St
- 1604 Dwight Way
- 1515 Derby St
- 1612 Parker St
- 1612 Carleton St
- 2750 Sacramento St
- 1450 Ward St
- 2758 Sacramento St
- 2717 Mabel St
- 1634 Blake St
- 1144 Dwight Way
- 1142 Dwight Way
- 1135 Parker St
- 2774 Sacramento St
- 1645 Dwight Way
- 2782 Sacramento St
- 2790 Sacramento St
- 1118 Dwight Way
- 2324 Browning St
- 1092 Dwight Way
Your Personal Tour Guide
Ask me questions while you tour the home.