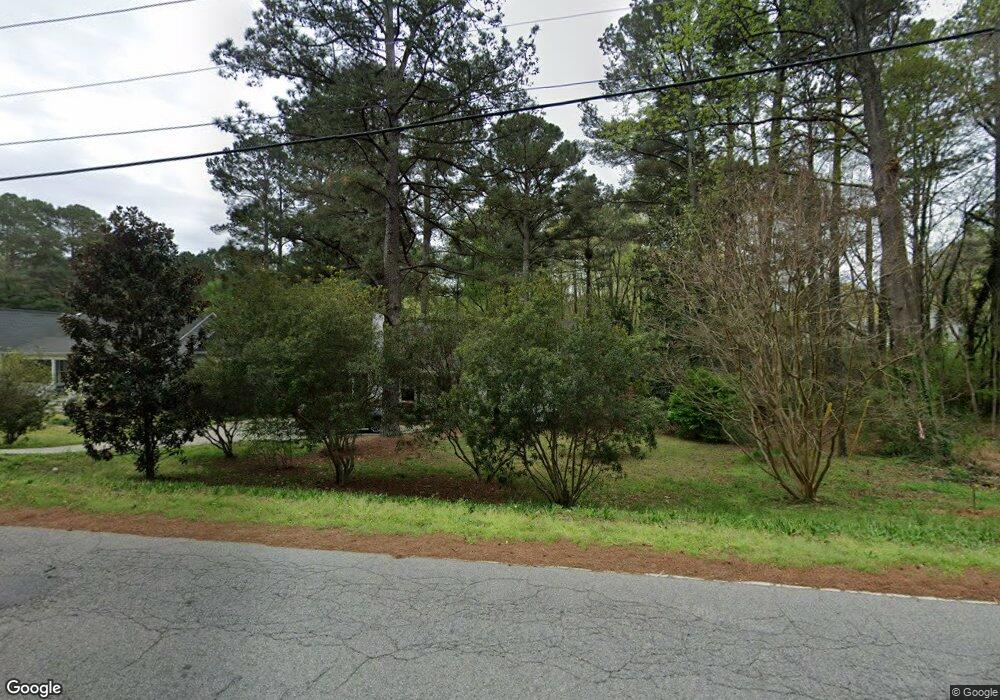
1441 Carolina Pines Ave Raleigh, NC 27603
South Raleigh NeighborhoodEstimated Value: $326,000 - $342,914
--
Bed
2
Baths
1,278
Sq Ft
$260/Sq Ft
Est. Value
About This Home
This home is located at 1441 Carolina Pines Ave, Raleigh, NC 27603 and is currently estimated at $332,729, approximately $260 per square foot. 1441 Carolina Pines Ave is a home located in Wake County with nearby schools including Penny Road Elementary School, Apex Middle, and Apex High School.
Ownership History
Date
Name
Owned For
Owner Type
Purchase Details
Closed on
Oct 11, 2001
Sold by
Singletary Jonathan D and Singletary Wendy L
Bought by
Singletary Jonathan D
Current Estimated Value
Home Financials for this Owner
Home Financials are based on the most recent Mortgage that was taken out on this home.
Original Mortgage
$92,000
Outstanding Balance
$35,959
Interest Rate
6.87%
Estimated Equity
$296,770
Purchase Details
Closed on
Apr 23, 1998
Sold by
Singletary Jonathan D
Bought by
Singletary Jonathan D and Singletary Wendy L
Home Financials for this Owner
Home Financials are based on the most recent Mortgage that was taken out on this home.
Original Mortgage
$94,900
Interest Rate
7.09%
Purchase Details
Closed on
Jun 21, 1996
Bought by
Singletary Jonathan D
Create a Home Valuation Report for This Property
The Home Valuation Report is an in-depth analysis detailing your home's value as well as a comparison with similar homes in the area
Home Values in the Area
Average Home Value in this Area
Purchase History
| Date | Buyer | Sale Price | Title Company |
|---|---|---|---|
| Singletary Jonathan D | -- | -- | |
| Singletary Jonathan D | -- | -- | |
| Singletary Jonathan D | $100,000 | -- |
Source: Public Records
Mortgage History
| Date | Status | Borrower | Loan Amount |
|---|---|---|---|
| Open | Singletary Jonathan D | $92,000 | |
| Closed | Singletary Jonathan D | $94,900 | |
| Closed | Singletary Jonathan D | $17,250 |
Source: Public Records
Tax History Compared to Growth
Tax History
| Year | Tax Paid | Tax Assessment Tax Assessment Total Assessment is a certain percentage of the fair market value that is determined by local assessors to be the total taxable value of land and additions on the property. | Land | Improvement |
|---|---|---|---|---|
| 2025 | $2,921 | $332,613 | $159,500 | $173,113 |
| 2024 | $2,909 | $332,613 | $159,500 | $173,113 |
| 2023 | $2,223 | $202,085 | $66,000 | $136,085 |
| 2022 | $2,066 | $202,085 | $66,000 | $136,085 |
| 2021 | $1,986 | $202,085 | $66,000 | $136,085 |
| 2020 | $1,950 | $202,085 | $66,000 | $136,085 |
| 2019 | $1,628 | $138,792 | $35,200 | $103,592 |
| 2018 | $1,536 | $138,792 | $35,200 | $103,592 |
| 2017 | $1,464 | $138,792 | $35,200 | $103,592 |
| 2016 | $1,434 | $138,792 | $35,200 | $103,592 |
| 2015 | $1,502 | $143,162 | $39,600 | $103,562 |
| 2014 | -- | $143,162 | $39,600 | $103,562 |
Source: Public Records
Map
Nearby Homes
- 2017 Rabbit Run
- 1441 Kirkland Rd
- 628 Oleander Rd
- 1709 Evergreen Ave
- 1036 Harper Rd
- 1032 Harper Rd
- 1024 Harper Rd
- 1008 Harper Rd
- 1020 Harper Rd
- 2801 Henslowe Dr
- 2901 Piney Ct
- 2208 Sierra Dr
- 1808 Betry Place
- 2028 Lost Ln
- 2005 Shenandoah Rd
- 1626 Bruce Cir
- 3113 Henslowe Dr
- 2837 Tryon Pines Dr
- 1625 Bruce Cir
- 2636 Scattered Oak Ct
- 1437 Carolina Pines Ave
- 1433 Carolina Pines Ave
- 1712 Picnic Place
- 2001 Kanga Cir
- 2000 Kanga Cir
- 1717 Picnic Place
- 1708 Picnic Place
- 1500 Carolina Pines Ave
- 1429 Carolina Pines Ave
- 2004 Kanga Cir
- 1511 Creekwood Ct Unit 101
- 1511 Creekwood Ct Unit 211
- 1511 Creekwood Ct Unit 304
- 1511 Creekwood Ct Unit 303
- 1511 Creekwood Ct Unit 302
- 1511 Creekwood Ct Unit 301
- 1511 Creekwood Ct Unit 204
- 1511 Creekwood Ct Unit 203
- 1511 Creekwood Ct Unit 202
- 1511 Creekwood Ct Unit 201