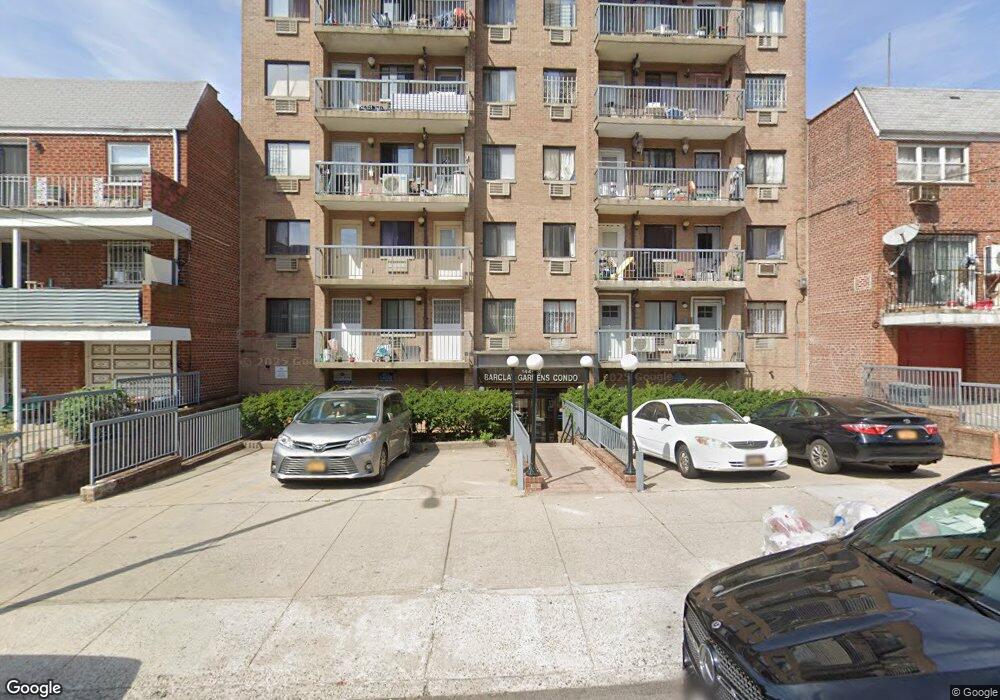
14423 Barclay Ave Unit 4C Flushing, NY 11355
Flushing NeighborhoodEstimated Value: $544,498 - $775,000
--
Bed
--
Bath
915
Sq Ft
$714/Sq Ft
Est. Value
About This Home
This home is located at 14423 Barclay Ave Unit 4C, Flushing, NY 11355 and is currently estimated at $653,375, approximately $714 per square foot. 14423 Barclay Ave Unit 4C is a home located in Queens County with nearby schools including P.S. 22 - Thomas Jefferson, Flushing High School, and Flushing Christian School.
Ownership History
Date
Name
Owned For
Owner Type
Purchase Details
Closed on
Jun 23, 2025
Sold by
Woo Bonnie W
Bought by
Bonnie W Woo As Trustee and The Bonnie W Woo Revocable Trust Dated
Current Estimated Value
Purchase Details
Closed on
Jul 24, 1997
Sold by
Bao Zhong Cheng and Bao Yuedi Zhang
Bought by
Woo Bonnie W
Home Financials for this Owner
Home Financials are based on the most recent Mortgage that was taken out on this home.
Original Mortgage
$70,000
Interest Rate
7.36%
Create a Home Valuation Report for This Property
The Home Valuation Report is an in-depth analysis detailing your home's value as well as a comparison with similar homes in the area
Home Values in the Area
Average Home Value in this Area
Purchase History
| Date | Buyer | Sale Price | Title Company |
|---|---|---|---|
| Bonnie W Woo As Trustee | -- | -- | |
| Woo Bonnie W | $106,000 | Chicago Title Insurance Co | |
| Woo Bonnie W | $106,000 | Chicago Title Insurance Co |
Source: Public Records
Mortgage History
| Date | Status | Borrower | Loan Amount |
|---|---|---|---|
| Previous Owner | Woo Bonnie W | $70,000 |
Source: Public Records
Tax History Compared to Growth
Tax History
| Year | Tax Paid | Tax Assessment Tax Assessment Total Assessment is a certain percentage of the fair market value that is determined by local assessors to be the total taxable value of land and additions on the property. | Land | Improvement |
|---|---|---|---|---|
| 2025 | $3,769 | $38,423 | $2,129 | $36,294 |
| 2024 | $3,909 | $36,441 | $2,129 | $34,312 |
| 2023 | $4,412 | $41,584 | $2,129 | $39,455 |
| 2022 | $4,379 | $41,180 | $2,129 | $39,051 |
| 2021 | $4,233 | $39,779 | $2,129 | $37,650 |
| 2020 | $4,535 | $45,743 | $2,129 | $43,614 |
| 2019 | $1,119 | $44,410 | $2,129 | $42,281 |
| 2018 | $1,665 | $36,348 | $2,128 | $34,220 |
| 2017 | $3,758 | $33,230 | $2,129 | $31,101 |
| 2016 | $3,448 | $33,230 | $2,129 | $31,101 |
| 2015 | $2,155 | $29,734 | $2,129 | $27,605 |
| 2014 | $2,155 | $28,037 | $2,129 | $25,908 |
Source: Public Records
Map
Nearby Homes
- 144-23 Barclay Ave Unit 6B
- 144-28 Barclay Ave Unit 7B
- 4133 Parsons Blvd Unit 3C
- 14444 41st Ave Unit 3E
- 144-49 Barclay Ave Unit C1
- 144-44 41st Ave Unit 2N
- 144-27 Sanford Ave Unit 8
- 144-27 Sanford Ave Unit 4
- 144-11 Sanford Ave Unit 4K
- 144-69 Barclay Ave Unit 3D
- 144-69 Barclay Ave Unit 6A
- 144-69 Barclay Ave Unit 7C
- 144-30 Sanford Ave Unit 2C
- 144-30 Sanford Ave Unit 6V
- 144-30 Sanford Ave Unit 5
- 144-30 Sanford Ave Unit 4N
- 144-70 41st Ave Unit 4D
- 144-44 Sanford Ave Unit 3
- 14430 Roosevelt Ave Unit 104
- 144-54 Sanford Ave Unit 38
- 14423 Barclay Ave Unit 2D
- 14423 Barclay Ave Unit 6D
- 14423 Barclay Ave Unit 6C
- 14423 Barclay Ave Unit 6B
- 14423 Barclay Ave Unit 6A
- 14423 Barclay Ave Unit 5D
- 14423 Barclay Ave Unit 5C
- 14423 Barclay Ave Unit 5B
- 14423 Barclay Ave Unit 5A
- 14423 Barclay Ave Unit 4D
- 14423 Barclay Ave Unit 4B
- 14423 Barclay Ave Unit 4A
- 14423 Barclay Ave Unit 3D
- 14423 Barclay Ave Unit 3C
- 14423 Barclay Ave Unit 3B
- 14423 Barclay Ave Unit 3A
- 14423 Barclay Ave Unit 2D
- 14423 Barclay Ave Unit 2C
- 14423 Barclay Ave Unit 2B
- 14423 Barclay Ave Unit 2A