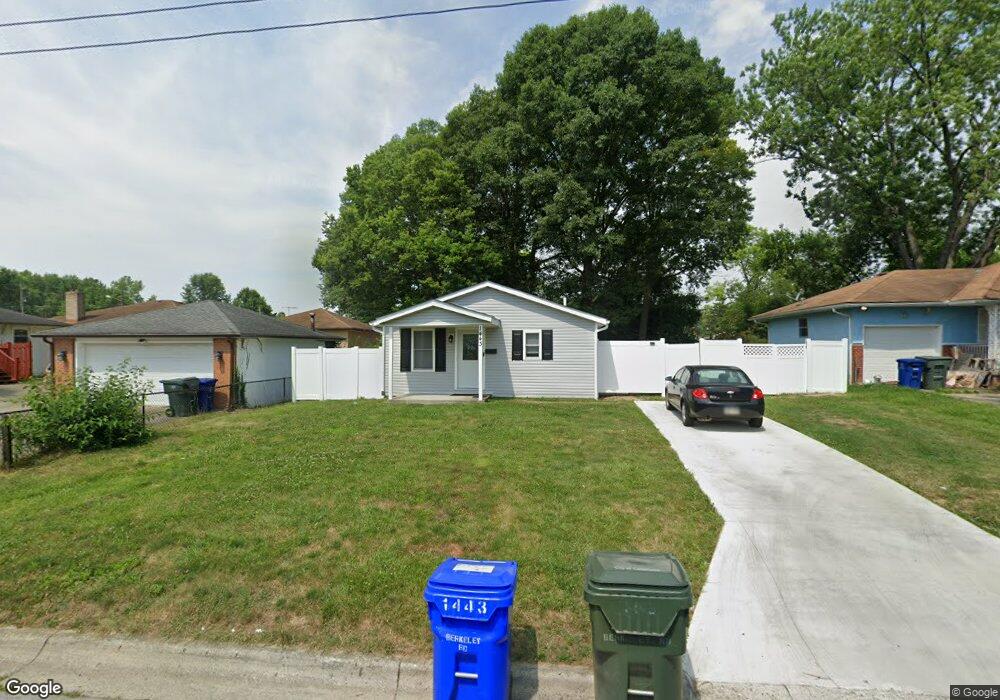
1443 Berkeley Rd Columbus, OH 43206
Deshler Park NeighborhoodEstimated Value: $172,000 - $227,000
4
Beds
2
Baths
1,250
Sq Ft
$161/Sq Ft
Est. Value
About This Home
This home is located at 1443 Berkeley Rd, Columbus, OH 43206 and is currently estimated at $200,996, approximately $160 per square foot. 1443 Berkeley Rd is a home located in Franklin County with nearby schools including Moler Elementary School, South High School, and Capital Collegiate Preparatory Academy.
Ownership History
Date
Name
Owned For
Owner Type
Purchase Details
Closed on
Jul 22, 2022
Sold by
Sim Maokhamphiou
Bought by
Dillard Douglas M
Current Estimated Value
Purchase Details
Closed on
Apr 19, 2005
Sold by
Hud
Bought by
Maokhamphiou Sim and Maokhamphiou Lea
Purchase Details
Closed on
Jan 27, 2005
Sold by
Watkins Donna and Midfirst Bank
Bought by
Hud
Purchase Details
Closed on
Sep 20, 1997
Sold by
Watkins Donna J and Watkins Donna
Bought by
Watkins Donna J and Watkins Robert E
Purchase Details
Closed on
May 28, 1997
Sold by
Mcdonald Jones Gloria D
Bought by
Watkins Donna
Home Financials for this Owner
Home Financials are based on the most recent Mortgage that was taken out on this home.
Original Mortgage
$62,322
Interest Rate
8.17%
Mortgage Type
FHA
Purchase Details
Closed on
Jan 10, 1991
Create a Home Valuation Report for This Property
The Home Valuation Report is an in-depth analysis detailing your home's value as well as a comparison with similar homes in the area
Home Values in the Area
Average Home Value in this Area
Purchase History
We collect this data history from publicly available records. To have your information removed, we recommend requesting removal directly through your county’s website.
| Date | Buyer | Sale Price | Title Company |
|---|---|---|---|
| Dillard Douglas M | $40,000 | None Listed On Document | |
| Maokhamphiou Sim | $34,000 | -- | |
| Hud | $40,000 | -- | |
| Watkins Donna J | -- | -- | |
| Watkins Donna | $63,000 | Preferred Title Agency Inc | |
| -- | $55,800 | -- |
Source: Public Records
Mortgage History
We collect this data history from publicly available records. To have your information removed, we recommend requesting removal directly through your county’s website.
| Date | Status | Borrower | Loan Amount |
|---|---|---|---|
| Previous Owner | Watkins Donna | $62,322 |
Source: Public Records
Tax History
| Year | Tax Paid | Tax Assessment Tax Assessment Total Assessment is a certain percentage of the fair market value that is determined by local assessors to be the total taxable value of land and additions on the property. | Land | Improvement |
|---|---|---|---|---|
| 2025 | $3,857 | $53,130 | $14,700 | $38,430 |
| 2024 | $3,857 | $53,130 | $14,700 | $38,430 |
| 2023 | $2,964 | $53,130 | $14,700 | $38,430 |
| 2022 | $4,551 | $21,530 | $6,580 | $14,950 |
| 2021 | $1,773 | $21,530 | $6,580 | $14,950 |
| 2020 | $1,148 | $21,530 | $6,580 | $14,950 |
| 2019 | $1,121 | $18,030 | $5,740 | $12,290 |
| 2018 | $1,261 | $18,030 | $5,740 | $12,290 |
| 2017 | $1,121 | $18,030 | $5,740 | $12,290 |
| 2016 | $1,542 | $22,690 | $5,220 | $17,470 |
| 2015 | $1,403 | $22,690 | $5,220 | $17,470 |
| 2014 | $1,407 | $22,690 | $5,220 | $17,470 |
| 2013 | $730 | $23,870 | $5,495 | $18,375 |
Source: Public Records
Map
Nearby Homes
- 1298 E Gates St
- 1330 Frebis Ave
- 1418-1422 Miller Ave
- 1306 Seymour Ave
- 1338 Lockbourne Rd
- 1318 Lockbourne Rd
- 1223 Berkeley Rd
- 1713 Kelton Ave
- 960 Studer Ave
- 1343 Linwood Ave
- 1219 Studer Ave Unit 1221
- 1136 Lockbourne Rd
- 1376 Wilson Ave
- 1105 Kelton Ave
- 1175 Studer Ave Unit 177
- 1130 Studer Ave
- 954 Miller Ave
- 1614 E Whittier St Unit 1614/1616
- 1514-1518 Wilson Ave
- 1804 Kelton Ave
- 1435 Berkeley Rd
- 1358 E Gates St
- 1364 E Gates St
- 1427 Berkeley Rd
- 1346 E Gates St
- 0 Berkeley Rd
- 1446 Berkeley Rd
- 1438 Lilley Ave
- 1419 Berkeley Rd
- 1460 Berkeley Rd
- 1430 Lilley Ave
- 1336 E Gates St
- 1424 Lilley Ave
- 1393 E Mithoff St
- 1411 Berkeley Rd
- 1392 E Gates St
- 1416 Lilley Ave
- 1384 E Mithoff St
- 1399 E Mithoff St
- 1408 Lilley Ave
Your Personal Tour Guide
Ask me questions while you tour the home.