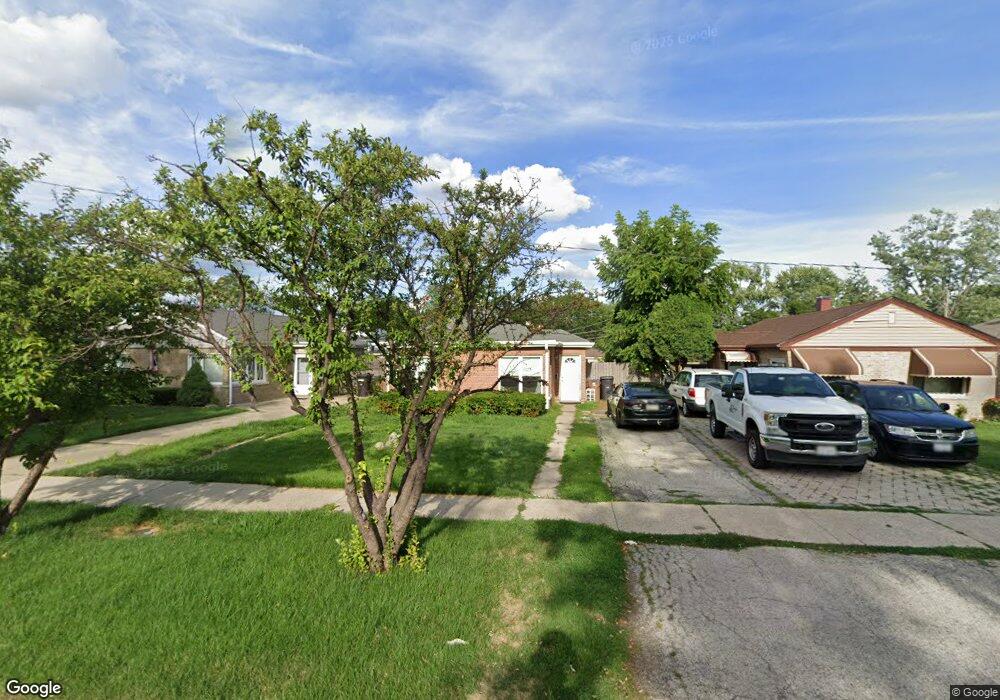
1443 N Taft Ave Berkeley, IL 60163
Estimated Value: $207,000 - $261,000
2
Beds
1
Bath
949
Sq Ft
$245/Sq Ft
Est. Value
About This Home
This home is located at 1443 N Taft Ave, Berkeley, IL 60163 and is currently estimated at $232,749, approximately $245 per square foot. 1443 N Taft Ave is a home located in Cook County with nearby schools including Macarthur Intermediate School, Sunnyside Elementary School, and Proviso West High School.
Ownership History
Date
Name
Owned For
Owner Type
Purchase Details
Closed on
Oct 12, 2011
Sold by
Federal Home Loan Mortgage Corporation
Bought by
Vizcarra Javier
Current Estimated Value
Purchase Details
Closed on
Oct 6, 2010
Sold by
Burgess Robert F
Bought by
Federal Home Loan Mortgage Corp
Purchase Details
Closed on
Feb 21, 1997
Sold by
Lapper Diane M and Fairchild Judy C
Bought by
Brylski Jacqueline R and Burgess Robert F
Home Financials for this Owner
Home Financials are based on the most recent Mortgage that was taken out on this home.
Original Mortgage
$74,350
Interest Rate
7.82%
Mortgage Type
FHA
Purchase Details
Closed on
Jul 10, 1995
Sold by
Fairchild Donald W
Bought by
Fairchild Donald W and Laper Diane M
Create a Home Valuation Report for This Property
The Home Valuation Report is an in-depth analysis detailing your home's value as well as a comparison with similar homes in the area
Home Values in the Area
Average Home Value in this Area
Purchase History
| Date | Buyer | Sale Price | Title Company |
|---|---|---|---|
| Vizcarra Javier | $31,500 | Attorneys Title Guaranty Fun | |
| Federal Home Loan Mortgage Corp | -- | None Available | |
| Brylski Jacqueline R | $75,000 | -- | |
| Fairchild Donald W | -- | -- |
Source: Public Records
Mortgage History
| Date | Status | Borrower | Loan Amount |
|---|---|---|---|
| Previous Owner | Brylski Jacqueline R | $74,350 |
Source: Public Records
Tax History
| Year | Tax Paid | Tax Assessment Tax Assessment Total Assessment is a certain percentage of the fair market value that is determined by local assessors to be the total taxable value of land and additions on the property. | Land | Improvement |
|---|---|---|---|---|
| 2025 | $6,182 | $20,000 | $3,264 | $16,736 |
| 2024 | $6,182 | $20,000 | $3,264 | $16,736 |
| 2023 | $5,651 | $20,000 | $3,264 | $16,736 |
| 2022 | $5,651 | $16,282 | $2,819 | $13,463 |
| 2021 | $5,672 | $16,282 | $2,819 | $13,463 |
| 2020 | $5,443 | $16,282 | $2,819 | $13,463 |
| 2019 | $3,678 | $12,106 | $2,522 | $9,584 |
| 2018 | $3,603 | $12,106 | $2,522 | $9,584 |
| 2017 | $3,468 | $12,106 | $2,522 | $9,584 |
| 2016 | $3,126 | $10,220 | $2,225 | $7,995 |
| 2015 | $3,066 | $10,220 | $2,225 | $7,995 |
| 2014 | $3,032 | $10,220 | $2,225 | $7,995 |
| 2013 | $3,163 | $11,269 | $2,225 | $9,044 |
Source: Public Records
Map
Nearby Homes
- 1428 1/2 N Ashbel Ave
- 1447 N Ashbel Ave
- 5706 Saint Charles Rd
- 5700 Saint Charles Rd
- 1529 N Hillside Ave
- 4938 W Randolph St
- 4904 W Hawthorne Ave
- 1038 Arthur Ave
- 5949 School St
- 515 S Parkview Ave
- 504 N Irving Ave
- 593 S Edgewood Ave
- 768 N Rohde Ave
- 605 N Wolf Rd Unit B9
- 520 N Wolf Rd Unit 203
- 1463 Speechley Blvd
- 330 E Saint Charles Rd
- 406 S Poplar Ave
- 244 S Linden Ave
- 250 N Irving Ave
- 1439 N Taft Ave
- 1447 N Taft Ave
- 1435 N Taft Ave
- 1451 N Taft Ave
- 1431 N Taft Ave
- 1430 N Ashbel Ave
- 1427 N Taft Ave
- 1442 N Ashbel Ave
- 1428 N Ashbel Ave
- 1428 N Ashbel Ave
- 1446 N Ashbel Ave
- 1501 N Taft Ave
- 1423 N Taft Ave
- 1424 N Ashbel Ave
- 1436 N Taft Ave
- 1440 N Taft Ave
- 1444 N Taft Ave
- 1507 N Taft Ave
- 1422 N Ashbel Ave
Your Personal Tour Guide
Ask me questions while you tour the home.