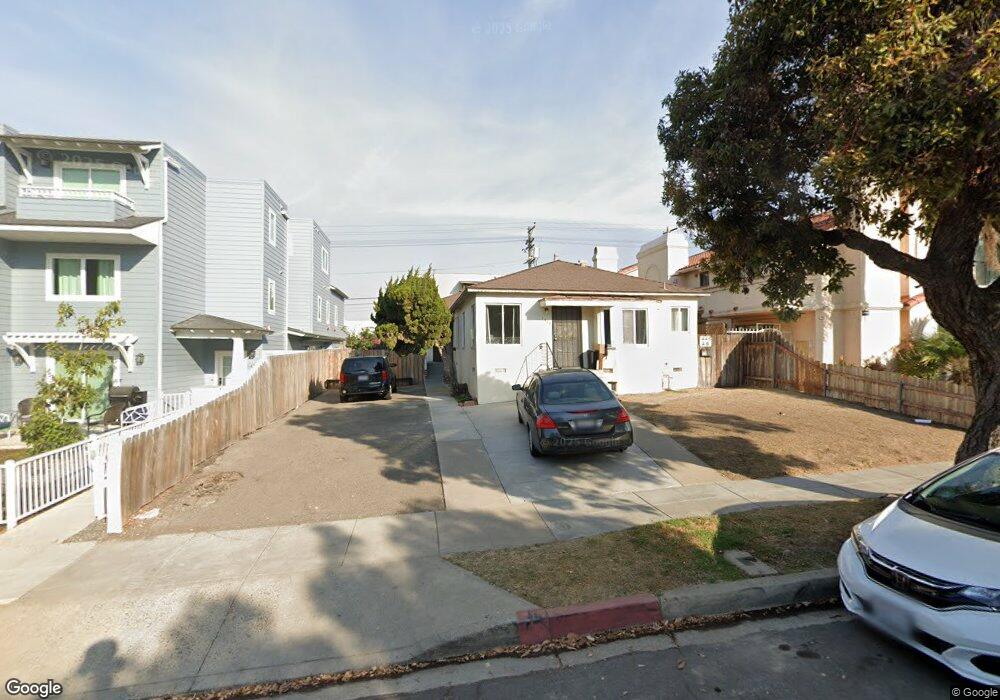
1444 Hornblend St Unit 46 San Diego, CA 92109
Pacific Beach NeighborhoodEstimated Value: $2,199,000 - $2,751,000
6
Beds
4
Baths
2,728
Sq Ft
$919/Sq Ft
Est. Value
About This Home
This home is located at 1444 Hornblend St Unit 46, San Diego, CA 92109 and is currently estimated at $2,506,000, approximately $918 per square foot. 1444 Hornblend St Unit 46 is a home located in San Diego County with nearby schools including Pacific Beach Elementary School, Pacific Beach Middle, and Mission Bay High School.
Ownership History
Date
Name
Owned For
Owner Type
Purchase Details
Closed on
Apr 25, 2002
Sold by
Stephan Steve A and Stephan Jeannette A
Bought by
Stephan Steve A and Stephan Jeannette A
Current Estimated Value
Home Financials for this Owner
Home Financials are based on the most recent Mortgage that was taken out on this home.
Original Mortgage
$355,000
Interest Rate
6.67%
Mortgage Type
Commercial
Purchase Details
Closed on
May 22, 1998
Sold by
Stephan Family Trust 02-09-96 and Steve A
Bought by
Stephan Steve A and Stephan Jeannette A
Home Financials for this Owner
Home Financials are based on the most recent Mortgage that was taken out on this home.
Original Mortgage
$255,000
Interest Rate
7.13%
Mortgage Type
Commercial
Purchase Details
Closed on
Feb 9, 1996
Sold by
Stephan Steve A and Stephan Jeannette A
Bought by
Stephan Steve A and Stephan Jeannette A
Purchase Details
Closed on
Jan 31, 1989
Create a Home Valuation Report for This Property
The Home Valuation Report is an in-depth analysis detailing your home's value as well as a comparison with similar homes in the area
Home Values in the Area
Average Home Value in this Area
Purchase History
| Date | Buyer | Sale Price | Title Company |
|---|---|---|---|
| Stephan Steve A | -- | -- | |
| Stephan Steve A | -- | First American Title Guarant | |
| Stephan Steve A | -- | Fidelity National Title Co | |
| Stephan Steve A | -- | -- | |
| -- | $385,000 | -- |
Source: Public Records
Mortgage History
| Date | Status | Borrower | Loan Amount |
|---|---|---|---|
| Closed | Stephan Steve A | $355,000 | |
| Closed | Stephan Steve A | $255,000 |
Source: Public Records
Tax History Compared to Growth
Tax History
| Year | Tax Paid | Tax Assessment Tax Assessment Total Assessment is a certain percentage of the fair market value that is determined by local assessors to be the total taxable value of land and additions on the property. | Land | Improvement |
|---|---|---|---|---|
| 2025 | $8,745 | $722,461 | $544,204 | $178,257 |
| 2024 | $8,745 | $708,296 | $533,534 | $174,762 |
| 2023 | $8,551 | $694,409 | $523,073 | $171,336 |
| 2022 | $8,323 | $680,794 | $512,817 | $167,977 |
| 2021 | $8,266 | $667,446 | $502,762 | $164,684 |
| 2020 | $8,166 | $660,603 | $497,607 | $162,996 |
| 2019 | $8,021 | $647,650 | $487,850 | $159,800 |
| 2018 | $7,500 | $634,952 | $478,285 | $156,667 |
| 2017 | $7,321 | $622,503 | $468,907 | $153,596 |
| 2016 | $7,202 | $610,298 | $459,713 | $150,585 |
| 2015 | $7,096 | $601,132 | $452,808 | $148,324 |
| 2014 | $6,986 | $589,358 | $443,939 | $145,419 |
Source: Public Records
Map
Nearby Homes
- 1434-44 Garnet Ave
- 1361 Felspar St Unit 7
- 1270 Emerald St
- 1733 Hornblend St
- 1220 Emerald St
- 4733 Ingraham St
- 4135 Fanuel St
- 1278 Pacific Beach Dr Unit 3
- 4071 Riviera Dr
- 4073 Riviera Dr
- 1807 Grand Ave
- 4037 Haines St
- 1885 Diamond St Unit 2-235
- 1885 Diamond St Unit 329
- 1885 Diamond St Unit 2-234
- 1122 Oliver Ave Unit U4
- 1775 Diamond St Unit 220
- 1801 Diamond St Unit 3-108
- 1152-54 Pacific Beach Dr
- 1300 Grand Ave Unit 38, 39
- 1450 Hornblend St
- 1436 Hornblend St
- 1436-38 Hornblend St
- 1436/38 Hornblend St
- 1460 Hornblend St
- 1438 Hornblend St
- 1424 Hornblend St
- 1468 Hornblend St
- 1420 Hornblend St
- 1443 Hornblend St
- 1478 Hornblend St
- 1451 Hornblend St
- 1451 Hornblend St
- 1451 Hornblend St
- 1445 Hornblend St Unit C
- 1445 Hornblend St Unit B
- 1445 Hornblend St Unit A
- 1429 Garnet Ave
- 1451 1/2 Hornblend St
- 1410 Hornblend St Unit 12