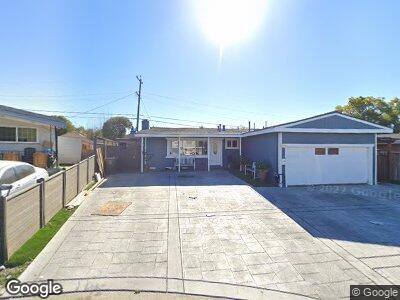
14450 Highgrove Ct San Jose, CA 95127
Alum Rock NeighborhoodEstimated Value: $955,000 - $1,032,000
3
Beds
2
Baths
960
Sq Ft
$1,053/Sq Ft
Est. Value
About This Home
This home is located at 14450 Highgrove Ct, San Jose, CA 95127 and is currently estimated at $1,010,993, approximately $1,053 per square foot. 14450 Highgrove Ct is a home located in Santa Clara County with nearby schools including Mt. Pleasant High School, Voices College-Bound Language Academy at Mt. Pleasant, and Rocketship Academy Brilliant Minds.
Ownership History
Date
Name
Owned For
Owner Type
Purchase Details
Closed on
Jan 17, 2014
Sold by
Verdin Porfirio
Bought by
Verdin Porfirio and Perez Bel Ulloa
Current Estimated Value
Purchase Details
Closed on
Jun 23, 2006
Sold by
Ullom Regina A and Ullom Douglas D
Bought by
Verdin Porfirio
Home Financials for this Owner
Home Financials are based on the most recent Mortgage that was taken out on this home.
Original Mortgage
$508,000
Interest Rate
6.02%
Mortgage Type
Balloon
Purchase Details
Closed on
Nov 29, 2004
Sold by
Ullom Regina Ann and Ullom Douglas
Bought by
Ullom Douglas D and Ullom Regina A
Home Financials for this Owner
Home Financials are based on the most recent Mortgage that was taken out on this home.
Original Mortgage
$380,000
Interest Rate
7.25%
Mortgage Type
New Conventional
Create a Home Valuation Report for This Property
The Home Valuation Report is an in-depth analysis detailing your home's value as well as a comparison with similar homes in the area
Home Values in the Area
Average Home Value in this Area
Purchase History
| Date | Buyer | Sale Price | Title Company |
|---|---|---|---|
| Verdin Porfirio | $317,500 | None Available | |
| Verdin Porfirio | $635,000 | Alliance Title Company | |
| Ullom Douglas D | -- | -- |
Source: Public Records
Mortgage History
| Date | Status | Borrower | Loan Amount |
|---|---|---|---|
| Previous Owner | Verdin Porfirio | $127,000 | |
| Previous Owner | Verdin Porfirio | $508,000 | |
| Previous Owner | Ullom Douglas D | $380,000 | |
| Previous Owner | Ullom Douglas | $300,000 | |
| Previous Owner | Ullom Douglas | $50,000 | |
| Previous Owner | Ullom Douglas | $235,800 |
Source: Public Records
Tax History Compared to Growth
Tax History
| Year | Tax Paid | Tax Assessment Tax Assessment Total Assessment is a certain percentage of the fair market value that is determined by local assessors to be the total taxable value of land and additions on the property. | Land | Improvement |
|---|---|---|---|---|
| 2024 | $9,478 | $672,413 | $528,922 | $143,491 |
| 2023 | $9,120 | $659,229 | $518,551 | $140,678 |
| 2022 | $9,000 | $646,304 | $508,384 | $137,920 |
| 2021 | $9,076 | $633,632 | $498,416 | $135,216 |
| 2020 | $8,741 | $627,136 | $493,306 | $133,830 |
| 2019 | $8,543 | $614,840 | $483,634 | $131,206 |
| 2018 | $8,367 | $602,785 | $474,151 | $128,634 |
| 2017 | $8,267 | $590,966 | $464,854 | $126,112 |
| 2016 | $8,027 | $579,380 | $455,740 | $123,640 |
| 2015 | $6,546 | $451,600 | $355,200 | $96,400 |
| 2014 | $5,675 | $386,000 | $308,800 | $77,200 |
Source: Public Records
Map
Nearby Homes
- 3423 Dominick Way
- 3432 Dominick Ct
- 10285 Chrisland Ct
- 10270 Ashdale Dr
- 10261 Claudia Dr
- 14220 Woodhaven Dr
- 10150 Clayton Rd
- 3277 Vernice Ave
- 3349 Aramis Dr
- 10041 Griffith St
- 3552 E Hills Dr
- 14080 Jerilyn Dr
- 3472 Kaylene Dr
- 10230 Griffith St
- 567 Nordyke Dr
- 120 Dale Dr
- 3405 Story Ln
- 1257 S White Rd
- 3297 Mount Wilson Dr
- 13831 Highwood Dr
- 14450 Highgrove Ct
- 14440 Highgrove Ct
- 14451 Vancouver Ct
- 14430 Highgrove Ct
- 14441 Vancouver Ct
- 14461 Vancouver Ct
- 14470 Highgrove Ct
- 14431 Vancouver Ct
- 14420 Highgrove Ct
- 14441 Highgrove Ct
- 14451 Highgrove Ct
- 14461 Highgrove Ct
- 10121 Meadow Ln
- 10131 Meadow Ln
- 14431 Highgrove Ct
- 14470 Vancouver Ct
- 14421 Vancouver Ct
- 10111 Meadow Ln
- 10141 Meadow Ln
- 14421 Highgrove Ct