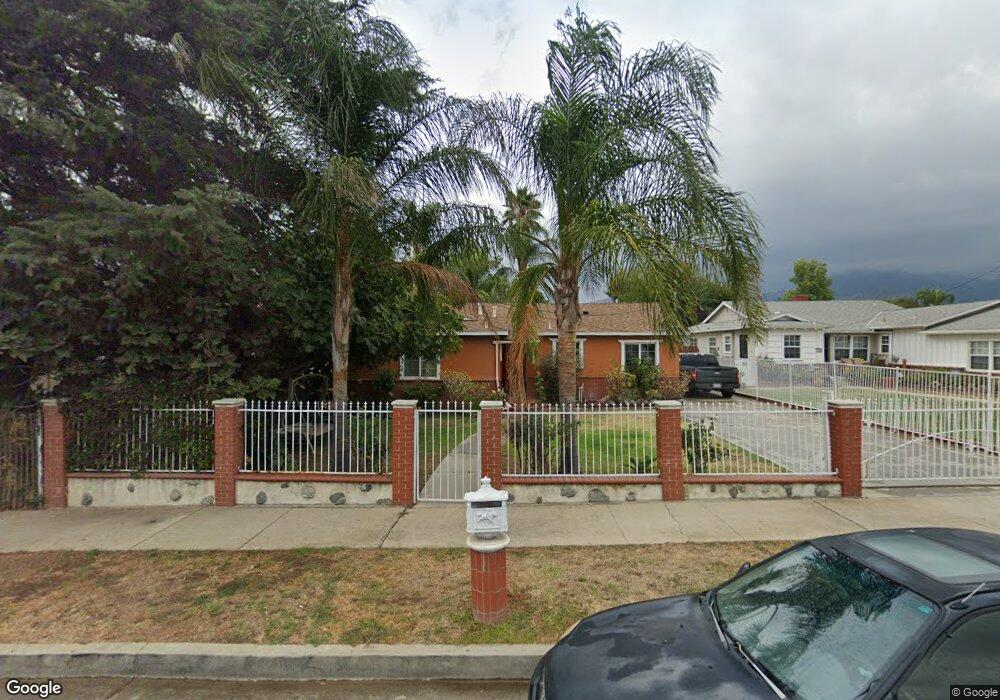
14457 Astoria St Sylmar, CA 91342
Estimated Value: $727,218 - $773,000
3
Beds
2
Baths
1,072
Sq Ft
$695/Sq Ft
Est. Value
About This Home
This home is located at 14457 Astoria St, Sylmar, CA 91342 and is currently estimated at $745,305, approximately $695 per square foot. 14457 Astoria St is a home located in Los Angeles County with nearby schools including Dyer Street Elementary School, Olive Vista Middle School, and San Fernando Senior High School.
Ownership History
Date
Name
Owned For
Owner Type
Purchase Details
Closed on
Dec 28, 2001
Sold by
Ruvalcaba Jose
Bought by
Ruvalcaba Jose and Ruvalcaba Leticia
Current Estimated Value
Home Financials for this Owner
Home Financials are based on the most recent Mortgage that was taken out on this home.
Original Mortgage
$86,507
Outstanding Balance
$34,570
Interest Rate
6.73%
Estimated Equity
$710,735
Purchase Details
Closed on
Sep 21, 1996
Sold by
Martinez Romelia
Bought by
Martinez Efren
Home Financials for this Owner
Home Financials are based on the most recent Mortgage that was taken out on this home.
Original Mortgage
$95,706
Interest Rate
8.1%
Mortgage Type
FHA
Purchase Details
Closed on
Sep 5, 1996
Sold by
Gupta Anand
Bought by
Ruvalcaba Jose and Ruvalcaba Leticia
Home Financials for this Owner
Home Financials are based on the most recent Mortgage that was taken out on this home.
Original Mortgage
$95,706
Interest Rate
8.1%
Mortgage Type
FHA
Create a Home Valuation Report for This Property
The Home Valuation Report is an in-depth analysis detailing your home's value as well as a comparison with similar homes in the area
Home Values in the Area
Average Home Value in this Area
Purchase History
| Date | Buyer | Sale Price | Title Company |
|---|---|---|---|
| Ruvalcaba Jose | -- | First American Title Ins Co | |
| Martinez Efren | -- | American Title Insurance Co | |
| Ruvalcaba Jose | $104,000 | American Title Insurance Co |
Source: Public Records
Mortgage History
| Date | Status | Borrower | Loan Amount |
|---|---|---|---|
| Open | Ruvalcaba Jose | $86,507 | |
| Closed | Ruvalcaba Jose | $95,706 |
Source: Public Records
Tax History Compared to Growth
Tax History
| Year | Tax Paid | Tax Assessment Tax Assessment Total Assessment is a certain percentage of the fair market value that is determined by local assessors to be the total taxable value of land and additions on the property. | Land | Improvement |
|---|---|---|---|---|
| 2025 | $2,388 | $179,651 | $89,887 | $89,764 |
| 2024 | $2,388 | $176,129 | $88,125 | $88,004 |
| 2023 | $2,346 | $172,677 | $86,398 | $86,279 |
| 2022 | $2,243 | $169,292 | $84,704 | $84,588 |
| 2021 | $2,212 | $165,974 | $83,044 | $82,930 |
| 2019 | $2,150 | $161,053 | $80,582 | $80,471 |
| 2018 | $2,059 | $157,896 | $79,002 | $78,894 |
| 2016 | $1,960 | $151,767 | $75,935 | $75,832 |
| 2015 | $1,933 | $149,488 | $74,795 | $74,693 |
| 2014 | $1,950 | $146,560 | $73,330 | $73,230 |
Source: Public Records
Map
Nearby Homes
- 14365 Berg St
- 14529 Paddock St
- 14594 Lyle St
- 12796 Norris Ave
- 13007 Glenoaks Blvd
- 13016 Jamie Ave
- 12867 Norris Ave
- 14785 Polk St
- 12563 Bradley Ave Unit 13
- 15235 152351/2 Nurmi St
- 14758 Lakeside St
- 13108 Fellows Ave
- 14840 Polk St
- 13009 Herrick Ave
- 14761 Astoria St
- 12642 Ralston Ave Unit 1
- 12603 Ralston Ave
- 12659 Ralston Ave
- 14335 Aztec St
- 14388 Beaver St
- 14451 Astoria St
- 14463 Astoria St
- 14445 Astoria St
- 14501 Astoria St
- 14518 Oro Grande St
- 14512 Oro Grande St
- 14522 Oro Grande St
- 14505 Astoria St
- 14506 Oro Grande St
- 14456 Astoria St
- 14530 Oro Grande St
- 14450 Astoria St
- 14462 Astoria St
- 14437 Astoria St
- 14444 Astoria St
- 14500 Astoria St
- 14502 Oro Grande St
- 14511 Astoria St
- 14536 Oro Grande St
- 14438 Astoria St