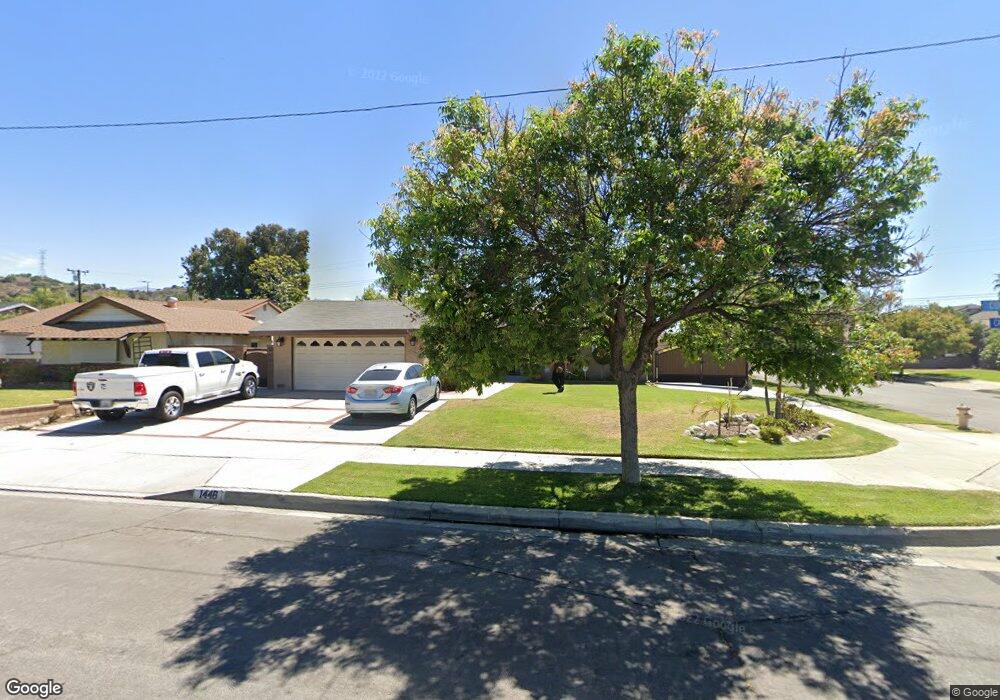
1446 S Concord Ln Glendora, CA 91740
Charter oak NeighborhoodEstimated Value: $907,000 - $964,556
4
Beds
3
Baths
1,960
Sq Ft
$474/Sq Ft
Est. Value
About This Home
This home is located at 1446 S Concord Ln, Glendora, CA 91740 and is currently estimated at $928,139, approximately $473 per square foot. 1446 S Concord Ln is a home located in Los Angeles County with nearby schools including Washington Elementary School, Royal Oak Middle School, and Charter Oak High School.
Ownership History
Date
Name
Owned For
Owner Type
Purchase Details
Closed on
Feb 8, 2007
Sold by
Baca John M and Baca Patricia J
Bought by
Baca John M
Current Estimated Value
Home Financials for this Owner
Home Financials are based on the most recent Mortgage that was taken out on this home.
Original Mortgage
$475,000
Outstanding Balance
$275,876
Interest Rate
5.62%
Mortgage Type
New Conventional
Estimated Equity
$652,263
Purchase Details
Closed on
Sep 11, 2003
Sold by
Gomez Diana
Bought by
Baca John M
Home Financials for this Owner
Home Financials are based on the most recent Mortgage that was taken out on this home.
Original Mortgage
$272,000
Interest Rate
5.25%
Mortgage Type
Purchase Money Mortgage
Purchase Details
Closed on
Dec 1, 1998
Sold by
Husbands Shirley D
Bought by
Husbands Shirley D and The Shirley D Husbands Trust
Purchase Details
Closed on
Jun 6, 1995
Sold by
Husbands Bernard S
Bought by
Husbands Shirley D
Create a Home Valuation Report for This Property
The Home Valuation Report is an in-depth analysis detailing your home's value as well as a comparison with similar homes in the area
Home Values in the Area
Average Home Value in this Area
Purchase History
| Date | Buyer | Sale Price | Title Company |
|---|---|---|---|
| Baca John M | -- | First American Title | |
| Baca John M | $340,000 | Southland Title | |
| Gomez Diana | -- | Southland Title | |
| Gomez Diana | -- | Southland Title | |
| Husbands Shirley D | -- | -- | |
| Husbands Shirley D | -- | -- |
Source: Public Records
Mortgage History
| Date | Status | Borrower | Loan Amount |
|---|---|---|---|
| Open | Baca John M | $475,000 | |
| Closed | Baca John M | $272,000 | |
| Closed | Baca John M | $34,000 |
Source: Public Records
Tax History Compared to Growth
Tax History
| Year | Tax Paid | Tax Assessment Tax Assessment Total Assessment is a certain percentage of the fair market value that is determined by local assessors to be the total taxable value of land and additions on the property. | Land | Improvement |
|---|---|---|---|---|
| 2025 | $7,270 | $604,830 | $350,179 | $254,651 |
| 2024 | $7,270 | $592,971 | $343,313 | $249,658 |
| 2023 | $7,094 | $581,345 | $336,582 | $244,763 |
| 2022 | $7,006 | $569,947 | $329,983 | $239,964 |
| 2021 | $6,899 | $558,772 | $323,513 | $235,259 |
| 2019 | $6,746 | $542,200 | $313,918 | $228,282 |
| 2018 | $6,390 | $531,569 | $307,763 | $223,806 |
| 2016 | $5,587 | $464,793 | $295,813 | $168,980 |
| 2015 | $5,562 | $457,812 | $291,370 | $166,442 |
| 2014 | $5,551 | $448,845 | $285,663 | $163,182 |
Source: Public Records
Map
Nearby Homes
- 352 Temmera Ln
- 244 E Newburgh St
- 1219 S Concord Ln
- 346 E Plymouth St
- 149 Rosalynn Dr
- 201 E Arrow Hwy Unit 64
- 201 E Arrow Hwy
- 201 E Arrow Hwy Unit 12
- 1309 Suffolk Ave
- 1735 S Banna Ave
- 1700 S Glendora Ave Unit 40
- 1700 S Glendora Ave Unit 43
- 299 E Arrow Hwy Unit 4
- 134 W Laxford St
- 20232 E Arrow Hwy Unit A
- 735 Essex St
- 19850 E Arrow Hwy Unit E-9
- 19850 E Arrow Hwy Unit C8
- 19850 E Arrow Hwy Unit E5
- 330 W Payson St
- 1438 S Concord Ln
- 335 E Camden St
- 1430 S Concord Ln
- 328 E Camden St
- 320 E Camden St
- 1437 S New Haven Ct
- 343 E Camden St
- 336 E Camden St
- 1445 S Concord Ln
- 312 E Camden St
- 1437 S Concord Ln
- 1422 S Concord Ln
- 1425 S New Haven Ct
- 344 E Camden St
- 1429 S Concord Ln
- 325 Trenton Ct
- 304 E Camden St
- 355 E Camden St
- 322 Trenton Ct
- 1414 S Concord Ln