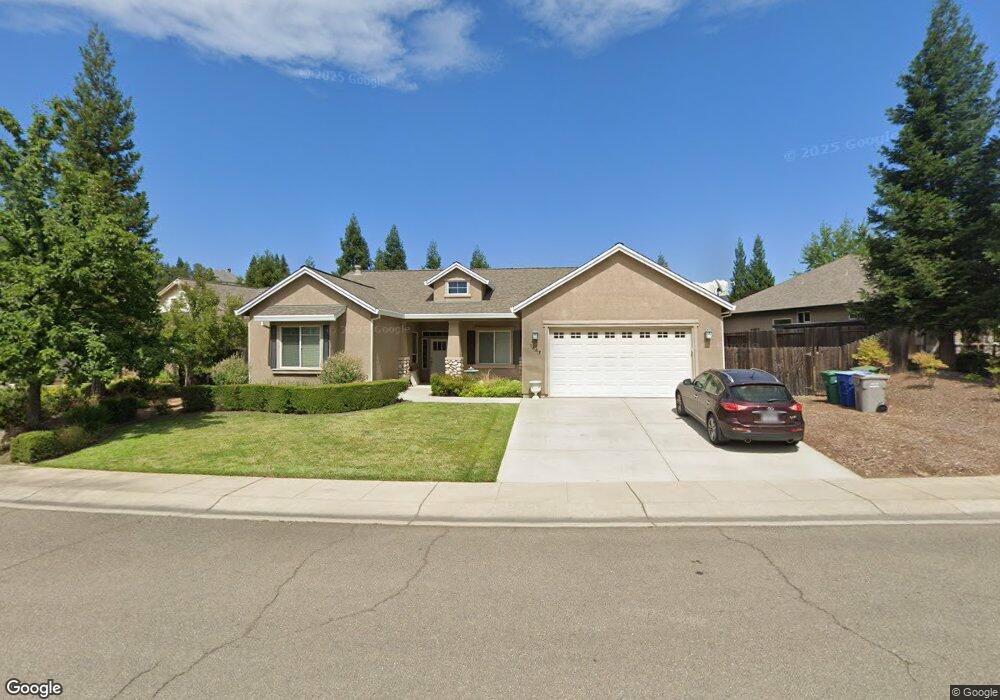
1447 Jen Way Redding, CA 96001
Manzanita NeighborhoodEstimated Value: $483,201 - $556,000
3
Beds
2
Baths
1,820
Sq Ft
$280/Sq Ft
Est. Value
About This Home
This home is located at 1447 Jen Way, Redding, CA 96001 and is currently estimated at $509,550, approximately $279 per square foot. 1447 Jen Way is a home located in Shasta County with nearby schools including Manzanita Elementary School, Sequoia Middle School, and Shasta High School.
Ownership History
Date
Name
Owned For
Owner Type
Purchase Details
Closed on
Nov 5, 2010
Sold by
Stemple Dale R and Stemple Karen
Bought by
Stemple Dale Robert and Stemple Karen M
Current Estimated Value
Purchase Details
Closed on
Sep 27, 2007
Sold by
Prudential Relocation Inc
Bought by
Stemple Dale R and Stemple Karen
Home Financials for this Owner
Home Financials are based on the most recent Mortgage that was taken out on this home.
Original Mortgage
$288,000
Interest Rate
6.12%
Mortgage Type
Purchase Money Mortgage
Purchase Details
Closed on
Jul 21, 2007
Sold by
Sibbett Christopher J and West Sibbett Rebecca
Bought by
Prudential Relocation Inc
Purchase Details
Closed on
Apr 19, 2007
Sold by
Premier Homes Properties Inc
Bought by
Sibbett Christopher J and West Sibbett Rebecca
Home Financials for this Owner
Home Financials are based on the most recent Mortgage that was taken out on this home.
Original Mortgage
$277,900
Interest Rate
6.15%
Mortgage Type
Purchase Money Mortgage
Create a Home Valuation Report for This Property
The Home Valuation Report is an in-depth analysis detailing your home's value as well as a comparison with similar homes in the area
Home Values in the Area
Average Home Value in this Area
Purchase History
| Date | Buyer | Sale Price | Title Company |
|---|---|---|---|
| Stemple Dale Robert | -- | None Available | |
| Stemple Dale R | $360,000 | Fidelity Title | |
| Prudential Relocation Inc | $360,000 | Fidelity Title | |
| Sibbett Christopher J | $368,000 | Placer Title Company |
Source: Public Records
Mortgage History
| Date | Status | Borrower | Loan Amount |
|---|---|---|---|
| Closed | Stemple Dale R | $288,000 | |
| Previous Owner | Sibbett Christopher J | $277,900 |
Source: Public Records
Tax History
| Year | Tax Paid | Tax Assessment Tax Assessment Total Assessment is a certain percentage of the fair market value that is determined by local assessors to be the total taxable value of land and additions on the property. | Land | Improvement |
|---|---|---|---|---|
| 2025 | $5,243 | $472,849 | $151,046 | $321,803 |
| 2024 | $5,152 | $463,579 | $148,085 | $315,494 |
| 2023 | $5,152 | $454,490 | $145,182 | $309,308 |
| 2022 | $5,061 | $445,580 | $142,336 | $303,244 |
| 2021 | $4,477 | $385,000 | $65,000 | $320,000 |
| 2020 | $4,445 | $375,000 | $65,000 | $310,000 |
| 2019 | $4,244 | $370,000 | $80,000 | $290,000 |
| 2018 | $4,088 | $345,000 | $75,000 | $270,000 |
| 2017 | $3,717 | $324,000 | $77,000 | $247,000 |
| 2016 | $3,843 | $324,000 | $77,000 | $247,000 |
| 2015 | $3,549 | $315,000 | $75,000 | $240,000 |
| 2014 | $3,592 | $297,000 | $70,000 | $227,000 |
Source: Public Records
Map
Nearby Homes
- 3582 Stone Ridge Place
- 3821 Pebble Dr
- 1426 Gladstone Ct
- 3701 Cal Ore Dr
- 1430 Ridge Dr
- 3510 Eureka Way
- 1163 Sunriver Ln
- 3345 Oakwood Place
- 1355 Bambury Ct
- 938 Leisha Ln
- 3320 Stratford Ave
- 3380 Placer St
- 3126 Riesling Path
- 3330 Scenic Dr
- 3882 Fujiyama Way
- 1525 Oak St
- 1025 Chardonnay Walk
- 1692 Kildare Dr
- 4160 Travona Ct
- 1695 Kildare Dr
- 1447 Jen Way Unit Lot 33
- 1427 Jen Way Unit Lot 34
- 1427 Jen Way
- 1467 Jen Way Unit Lot 32
- 1467 Jen Way
- 1157 Lakeside Dr Unit Lot 36
- 1157 Lakeside Dr
- 1137 Lakeside Dr Unit Lot 37
- 1137 Lakeside Dr
- 1407 Jen Way Unit Lot 35
- 1407 Jen Way
- 3668 Foothill Blvd
- 3638 Foothill Blvd Unit Lot 29
- 3638 Foothill Blvd
- 1406 Jen Way Unit 17
- 1406 Jen Way
- 1430 Jen Way Unit Lot 15
- 1430 Jen Way
- 1418 Jen Way Unit Lot 16
- 1418 Jen Way
Your Personal Tour Guide
Ask me questions while you tour the home.