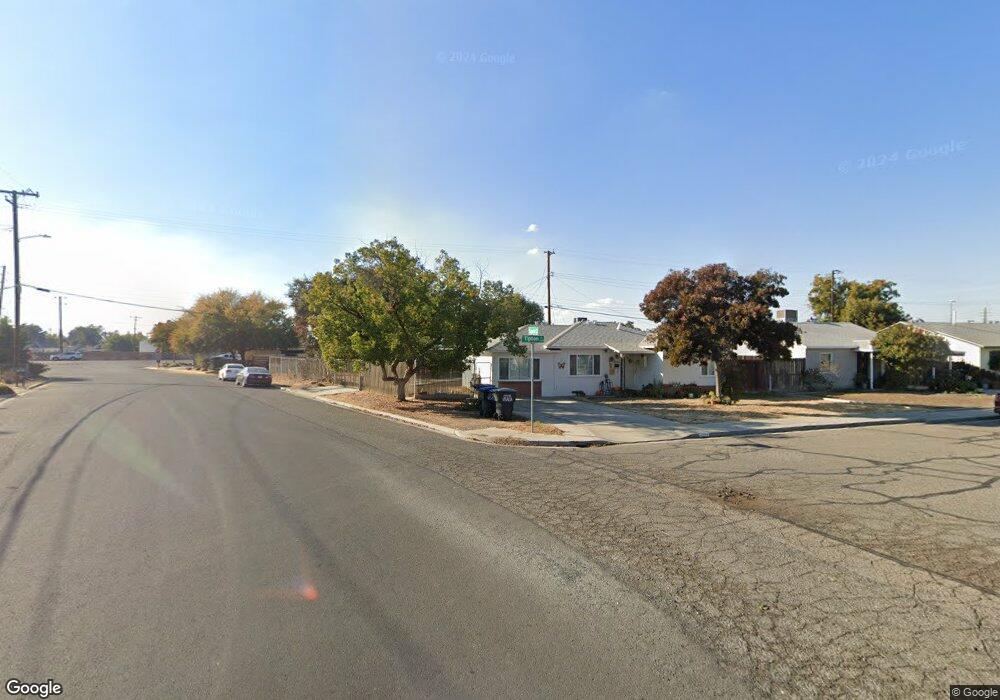
1448 S Tipton St Visalia, CA 93292
South Visalia NeighborhoodEstimated Value: $296,000 - $324,000
3
Beds
2
Baths
1,175
Sq Ft
$261/Sq Ft
Est. Value
About This Home
This home is located at 1448 S Tipton St, Visalia, CA 93292 and is currently estimated at $306,405, approximately $260 per square foot. 1448 S Tipton St is a home located in Tulare County with nearby schools including Pinkham Elementary School, Valley Oak Middle School, and Golden West High School.
Ownership History
Date
Name
Owned For
Owner Type
Purchase Details
Closed on
Sep 17, 2024
Sold by
Carter James Gary and Carter Deborah Gay
Bought by
2024 Carter Family Trust and Carter
Current Estimated Value
Purchase Details
Closed on
Feb 29, 2000
Sold by
Hud
Bought by
Baisley Kevin
Home Financials for this Owner
Home Financials are based on the most recent Mortgage that was taken out on this home.
Original Mortgage
$73,773
Interest Rate
8.26%
Mortgage Type
FHA
Purchase Details
Closed on
Oct 27, 1999
Sold by
Midfirst Bank
Bought by
Hud
Purchase Details
Closed on
Sep 13, 1999
Sold by
Chavez Gary Howard
Bought by
Midfirst Bank
Purchase Details
Closed on
Nov 8, 1994
Sold by
Coffman Travis S
Bought by
Chavez Gary Howard and Chavez Kimberly Ann
Home Financials for this Owner
Home Financials are based on the most recent Mortgage that was taken out on this home.
Original Mortgage
$77,492
Interest Rate
9.25%
Mortgage Type
FHA
Create a Home Valuation Report for This Property
The Home Valuation Report is an in-depth analysis detailing your home's value as well as a comparison with similar homes in the area
Home Values in the Area
Average Home Value in this Area
Purchase History
| Date | Buyer | Sale Price | Title Company |
|---|---|---|---|
| 2024 Carter Family Trust | -- | None Listed On Document | |
| Baisley Kevin | $72,000 | Cuesta Title Company | |
| Hud | -- | United Title Company | |
| Midfirst Bank | $86,170 | United Title Company | |
| Chavez Gary Howard | $78,000 | Fidelity National Title |
Source: Public Records
Mortgage History
| Date | Status | Borrower | Loan Amount |
|---|---|---|---|
| Previous Owner | Baisley Kevin | $73,773 | |
| Previous Owner | Chavez Gary Howard | $77,492 |
Source: Public Records
Tax History Compared to Growth
Tax History
| Year | Tax Paid | Tax Assessment Tax Assessment Total Assessment is a certain percentage of the fair market value that is determined by local assessors to be the total taxable value of land and additions on the property. | Land | Improvement |
|---|---|---|---|---|
| 2025 | $1,100 | $110,666 | $46,112 | $64,554 |
| 2024 | $1,100 | $108,497 | $45,208 | $63,289 |
| 2023 | $1,068 | $106,371 | $44,322 | $62,049 |
| 2022 | $1,019 | $104,286 | $43,453 | $60,833 |
| 2021 | $1,019 | $102,241 | $42,601 | $59,640 |
| 2020 | $1,003 | $101,192 | $42,164 | $59,028 |
| 2019 | $979 | $99,208 | $41,337 | $57,871 |
| 2018 | $947 | $97,262 | $40,526 | $56,736 |
| 2017 | $942 | $95,355 | $39,731 | $55,624 |
| 2016 | $917 | $93,485 | $38,952 | $54,533 |
| 2015 | $888 | $92,081 | $38,367 | $53,714 |
| 2014 | $888 | $90,277 | $37,615 | $52,662 |
Source: Public Records
Map
Nearby Homes
- 631 E Cypress Ave
- 701 S Bridge St
- 908 S Clark St
- 833 E Myrtle Ave
- 439 S Bridge St Unit 5
- 1438 S Garden St
- 433 S Church St
- 101 W Howard Ave
- 1728 S Clark St
- 837 E Cambridge Ave
- 1926 S Thomas St
- 1339 E Feemster Ave
- 1737 S Bardo St
- 526 W Myrtle Ave
- 1100 E Main St
- 332 W Walnut Ave
- 1009 E Harter Dr
- 2325 E Harter Dr
- 941 E Harter Dr
- 2157 Spanish Plan at Willow Springs
- 1518 S Tipton St
- 601 E Laurel Ave
- 1001 S Tipton St
- 604 E Laurel Ave
- 605 E Laurel Ave
- 521 E Laurel Ave
- 921 S Tipton St
- 920 S Tipton St
- 609 E Laurel Ave
- 517 E Laurel Ave
- 917 S Tipton St
- 918 S Tipton St
- 613 E Laurel Ave
- 511 E Laurel Ave
- 504 E Laurel Ave
- 916 S Tipton St
- 915 S Tipton St
- 617 E Laurel Ave
- 918 S Santa fe St
- 505 E Laurel Ave