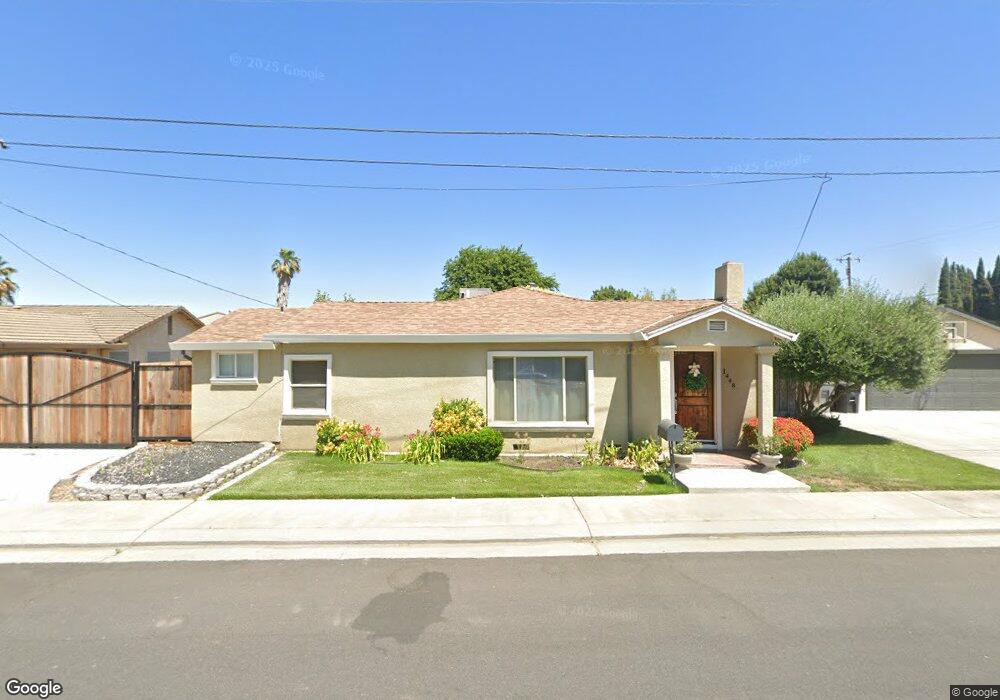
1448 Walnut Ave Escalon, CA 95320
Estimated Value: $446,665 - $521,000
3
Beds
2
Baths
1,369
Sq Ft
$349/Sq Ft
Est. Value
About This Home
This home is located at 1448 Walnut Ave, Escalon, CA 95320 and is currently estimated at $478,166, approximately $349 per square foot. 1448 Walnut Ave is a home located in San Joaquin County with nearby schools including Van Allen Elementary School, El Portal Middle School, and Escalon High School.
Ownership History
Date
Name
Owned For
Owner Type
Purchase Details
Closed on
Sep 11, 2015
Sold by
Herrera Aristeo and Herrera Soledad
Bought by
Velazquez Luis Ricardo and Velazquez Araceli
Current Estimated Value
Purchase Details
Closed on
Jun 16, 2008
Sold by
Us Bank Na
Bought by
Herrera Aristeo and Herrera Soledad
Home Financials for this Owner
Home Financials are based on the most recent Mortgage that was taken out on this home.
Original Mortgage
$162,701
Interest Rate
6.04%
Mortgage Type
FHA
Purchase Details
Closed on
Feb 15, 2008
Sold by
Ortega John and Ortega Judith
Bought by
Us Bank Na
Purchase Details
Closed on
Sep 28, 2005
Sold by
Bunch Calvin C and Bunch Evelyn N
Bought by
Ortega John and Ortega Judith
Home Financials for this Owner
Home Financials are based on the most recent Mortgage that was taken out on this home.
Original Mortgage
$304,000
Interest Rate
7.72%
Mortgage Type
Balloon
Create a Home Valuation Report for This Property
The Home Valuation Report is an in-depth analysis detailing your home's value as well as a comparison with similar homes in the area
Home Values in the Area
Average Home Value in this Area
Purchase History
| Date | Buyer | Sale Price | Title Company |
|---|---|---|---|
| Velazquez Luis Ricardo | -- | None Available | |
| Herrera Aristeo | $165,000 | Old Republic Title Company | |
| Us Bank Na | $188,800 | Accommodation | |
| Ortega John | $190,000 | Commonwealth Title Co |
Source: Public Records
Mortgage History
| Date | Status | Borrower | Loan Amount |
|---|---|---|---|
| Previous Owner | Herrera Aristeo | $162,701 | |
| Previous Owner | Ortega John | $304,000 |
Source: Public Records
Tax History
| Year | Tax Paid | Tax Assessment Tax Assessment Total Assessment is a certain percentage of the fair market value that is determined by local assessors to be the total taxable value of land and additions on the property. | Land | Improvement |
|---|---|---|---|---|
| 2025 | $2,514 | $216,714 | $85,371 | $131,343 |
| 2024 | $2,440 | $212,466 | $83,698 | $128,768 |
| 2023 | $2,400 | $208,301 | $82,057 | $126,244 |
| 2022 | $2,309 | $204,218 | $80,449 | $123,769 |
| 2021 | $2,333 | $200,215 | $78,872 | $121,343 |
| 2020 | $2,313 | $198,163 | $78,064 | $120,099 |
| 2019 | $2,280 | $194,279 | $76,534 | $117,745 |
| 2018 | $2,254 | $190,471 | $75,034 | $115,437 |
| 2017 | $2,197 | $186,737 | $73,563 | $113,174 |
| 2016 | $2,168 | $183,076 | $72,121 | $110,955 |
| 2015 | $2,048 | $180,327 | $71,038 | $109,289 |
| 2014 | $1,862 | $161,700 | $48,400 | $113,300 |
Source: Public Records
Map
Nearby Homes
- 931 Park Ave
- 1737 Sanchez Way
- 495 Valdapena Way
- 2507 Escalon-Bellota Rd
- 23873 State Highway 120
- 1970 Mchenry Ave
- 1521 Deborah Cir
- 1526 3rd St
- 2310 Main St
- 1529 Mitchell Ave
- 1634 Judith Way
- 1506 Mitchell Ave
- 2226 Edmart St
- 1647 Jerry Ave
- 1 Jackson
- 2322 Main St
- 2505 Jackson Ave Unit 113
- 2505 Jackson Ave Unit 132
- 2505 Jackson Ave Unit 138
- 2505 Jackson Ave Unit 178
- 624 California St
- 1414 Walnut Ave
- 562 California St
- 605 California St
- 1407 Walnut Ave
- 626 California St
- 1408 Walnut Ave
- 623 California St
- 556 California St
- 1501 Walnut Ave
- 1401 Walnut Ave
- 1346 Walnut Ave
- 1433 Irwin Ave
- 680 California St
- 1507 Walnut Ave
- 1520 Walnut Ave
- 1342 Walnut Ave
- 1353 Walnut Ave
- 550 California St
- 1404 Mosswood Ave
Your Personal Tour Guide
Ask me questions while you tour the home.