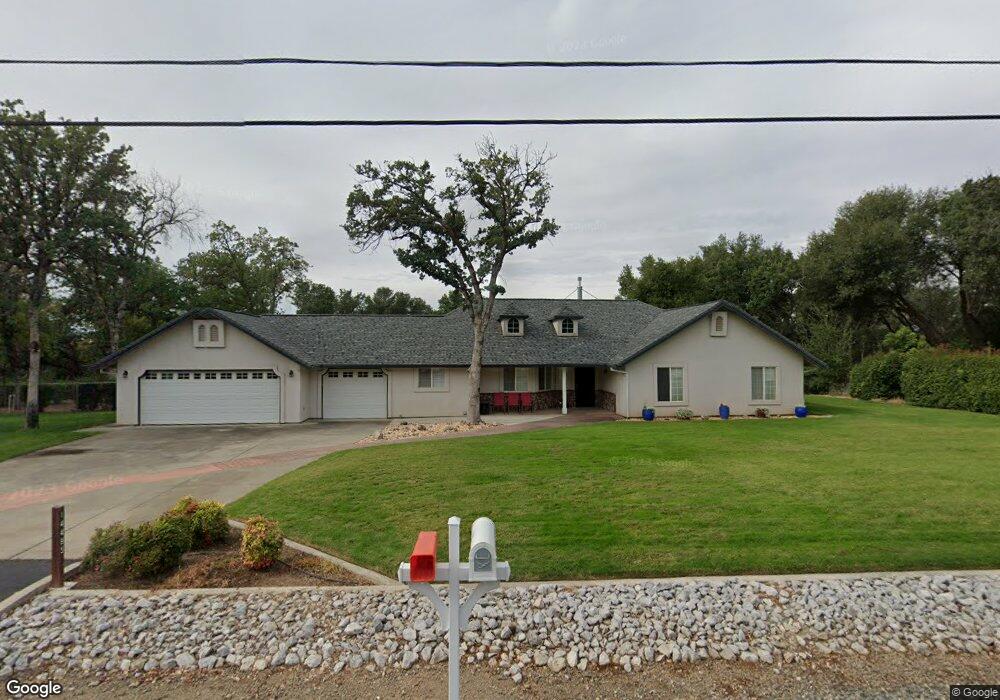
14485 Molluc Dr Red Bluff, CA 96080
Estimated Value: $551,125 - $789,000
3
Beds
2
Baths
1,974
Sq Ft
$321/Sq Ft
Est. Value
About This Home
This home is located at 14485 Molluc Dr, Red Bluff, CA 96080 and is currently estimated at $634,031, approximately $321 per square foot. 14485 Molluc Dr is a home located in Tehama County with nearby schools including Jackson Heights Elementary School, Vista Preparatory Academy, and Red Bluff High School.
Ownership History
Date
Name
Owned For
Owner Type
Purchase Details
Closed on
Jun 18, 2024
Sold by
Echols Family Revocable Trust and Echols Kayl G
Bought by
Stroing Casey W and Stroing Leah M
Current Estimated Value
Purchase Details
Closed on
Jul 15, 2021
Sold by
Echols Kayl G and Echols Pamela A
Bought by
Echols Kayl G and Echols Pamela A
Purchase Details
Closed on
Jan 29, 2015
Sold by
Baker Patricia S
Bought by
Echols Kayl G and Echols Pamela A
Home Financials for this Owner
Home Financials are based on the most recent Mortgage that was taken out on this home.
Original Mortgage
$271,600
Interest Rate
3.76%
Mortgage Type
New Conventional
Purchase Details
Closed on
Jul 8, 2008
Sold by
Clark Ronald L and Clark Katharine N
Bought by
Ramsey Brian H and Ramsey Katherine G
Purchase Details
Closed on
Aug 1, 2002
Sold by
Baker John C and Baker Patricia S
Bought by
Baker John C and Baker Patricia S
Create a Home Valuation Report for This Property
The Home Valuation Report is an in-depth analysis detailing your home's value as well as a comparison with similar homes in the area
Purchase History
| Date | Buyer | Sale Price | Title Company |
|---|---|---|---|
| Stroing Casey W | $540,000 | Placer Title Company | |
| Echols Kayl G | -- | None Available | |
| Echols Kayl G | $339,500 | Placer Title | |
| Ramsey Brian H | -- | None Available | |
| Baker John C | -- | -- |
Source: Public Records
Mortgage History
| Date | Status | Borrower | Loan Amount |
|---|---|---|---|
| Previous Owner | Echols Kayl G | $271,600 |
Source: Public Records
Tax History
| Year | Tax Paid | Tax Assessment Tax Assessment Total Assessment is a certain percentage of the fair market value that is determined by local assessors to be the total taxable value of land and additions on the property. | Land | Improvement |
|---|---|---|---|---|
| 2025 | $4,165 | $550,800 | $102,000 | $448,800 |
| 2023 | $4,094 | $392,176 | $92,410 | $299,766 |
| 2022 | $4,066 | $384,488 | $90,599 | $293,889 |
| 2021 | $3,902 | $376,950 | $88,823 | $288,127 |
| 2020 | $3,982 | $373,086 | $87,913 | $285,173 |
| 2019 | $4,007 | $365,772 | $86,190 | $279,582 |
| 2018 | $3,706 | $358,600 | $84,500 | $274,100 |
| 2017 | $3,738 | $351,570 | $82,844 | $268,726 |
| 2016 | $3,491 | $344,677 | $81,220 | $263,457 |
| 2015 | -- | $317,937 | $62,882 | $255,055 |
| 2014 | -- | $311,710 | $61,651 | $250,059 |
Source: Public Records
Map
Nearby Homes
- 14535 Molluc Dr
- 14430 Molluc Dr
- 20662 Saddlebrook Dr
- 14465 Ryan Ln
- 14815 Molluc Dr
- 14575 Kinney Ave
- 14605 Kinney Ave
- 21300 Meadowgate Dr
- 14805 Hilltop Dr Unit 14807 Hilltop Drive
- 14805 Hilltop Dr
- 14807 Hilltop Dr
- 21350 Wilcox Rd
- 14395 Del Oro Ct
- 14385 Del Oro Ct
- 4375 Via Ventura
- 14435 Del Oro Ct
- Lot D Aloe Place
- 00 Wilcox Rd
- 13905 Mendenhall Rd
- 00JB Old Mission Dr
- 14505 Molluc Dr
- 14465 Molluc Dr
- 14480 Molluc Dr
- 14515 Molluc Dr
- 14500 Molluc Dr
- 0000 Saddlebrook Dr
- 14460 Molluc Dr
- 14520 Molluc Dr
- 20735 Saddlebrook Dr
- 14540 Molluc Dr
- 14445 Molluc Dr
- 20669 Jessica Ct
- 20663 Jessica Ct
- 14555 Molluc Dr
- 14560 Molluc Dr
- 20656 Saddlebrook Dr
- 20664 Jessica Ct
- 20657 Jessica Ct
- 14420 Molluc Dr
- 14405 Kawil Ln
Your Personal Tour Guide
Ask me questions while you tour the home.