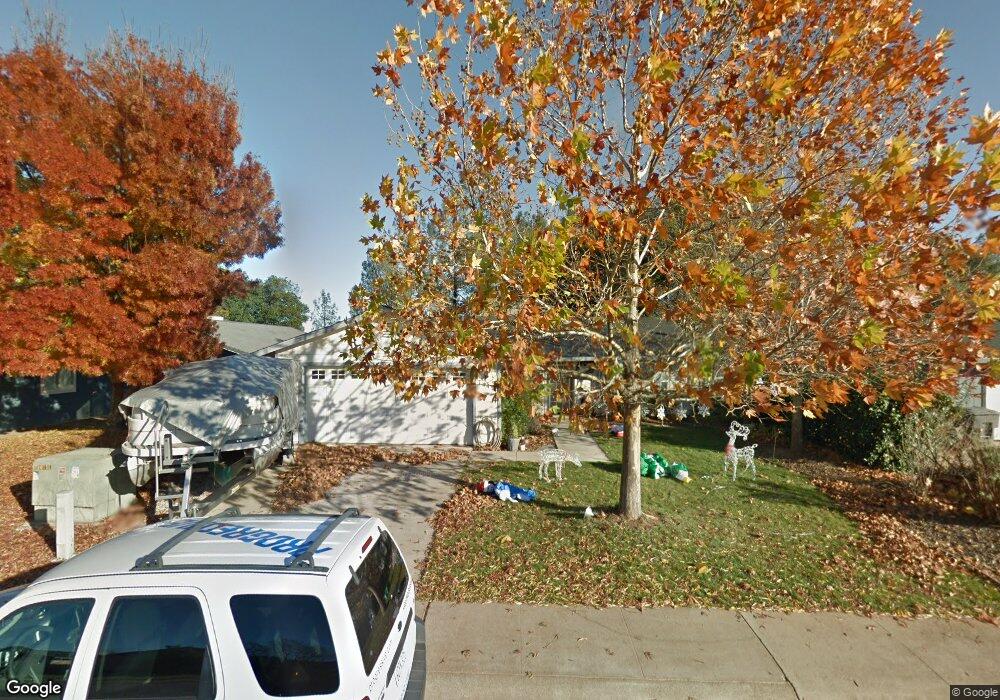
1449 Murieta Loop Redding, CA 96002
Enterprise NeighborhoodEstimated Value: $330,467 - $347,000
3
Beds
2
Baths
1,352
Sq Ft
$249/Sq Ft
Est. Value
About This Home
This home is located at 1449 Murieta Loop, Redding, CA 96002 and is currently estimated at $336,367, approximately $248 per square foot. 1449 Murieta Loop is a home located in Shasta County with nearby schools including Lassen View Elementary School, Parsons Junior High School, and Enterprise High School.
Ownership History
Date
Name
Owned For
Owner Type
Purchase Details
Closed on
Jun 15, 2012
Sold by
Snider Jason
Bought by
Snider Jason and Snider Jennifer
Current Estimated Value
Home Financials for this Owner
Home Financials are based on the most recent Mortgage that was taken out on this home.
Original Mortgage
$113,600
Outstanding Balance
$16,756
Interest Rate
3.74%
Mortgage Type
New Conventional
Estimated Equity
$319,611
Purchase Details
Closed on
Oct 20, 2003
Sold by
Snider Jennifer A
Bought by
Snider Jason
Home Financials for this Owner
Home Financials are based on the most recent Mortgage that was taken out on this home.
Original Mortgage
$118,300
Interest Rate
5.98%
Mortgage Type
Purchase Money Mortgage
Purchase Details
Closed on
Mar 7, 2002
Sold by
Gunner Inc
Bought by
Snider Jason
Home Financials for this Owner
Home Financials are based on the most recent Mortgage that was taken out on this home.
Original Mortgage
$113,981
Interest Rate
6.94%
Mortgage Type
FHA
Create a Home Valuation Report for This Property
The Home Valuation Report is an in-depth analysis detailing your home's value as well as a comparison with similar homes in the area
Home Values in the Area
Average Home Value in this Area
Purchase History
| Date | Buyer | Sale Price | Title Company |
|---|---|---|---|
| Snider Jason | -- | Placer Title Company | |
| Snider Jason | -- | Fidelity Natl Title Co Of Ca | |
| Snider Jason | $116,000 | Placer Title Company |
Source: Public Records
Mortgage History
| Date | Status | Borrower | Loan Amount |
|---|---|---|---|
| Open | Snider Jason | $113,600 | |
| Closed | Snider Jason | $118,300 | |
| Closed | Snider Jason | $113,981 |
Source: Public Records
Tax History
| Year | Tax Paid | Tax Assessment Tax Assessment Total Assessment is a certain percentage of the fair market value that is determined by local assessors to be the total taxable value of land and additions on the property. | Land | Improvement |
|---|---|---|---|---|
| 2025 | $1,802 | $171,343 | $44,305 | $127,038 |
| 2024 | $1,775 | $167,985 | $43,437 | $124,548 |
| 2023 | $1,775 | $164,692 | $42,586 | $122,106 |
| 2022 | $1,724 | $161,463 | $41,751 | $119,712 |
| 2021 | $1,664 | $158,298 | $40,933 | $117,365 |
| 2020 | $1,655 | $156,676 | $40,514 | $116,162 |
| 2019 | $1,641 | $153,605 | $39,720 | $113,885 |
| 2018 | $1,620 | $150,594 | $38,942 | $111,652 |
| 2017 | $1,647 | $147,642 | $38,179 | $109,463 |
| 2016 | $1,539 | $144,748 | $37,431 | $107,317 |
| 2015 | $1,526 | $142,574 | $36,869 | $105,705 |
| 2014 | $1,513 | $139,782 | $36,147 | $103,635 |
Source: Public Records
Map
Nearby Homes
- 1289 Arizona St
- 4302 Paulson Ln
- 4724 Squirrel Run Ct
- 4877 Squirrel Run Ct
- 4624 Columbine Dr
- 4487 Alta Saga Dr
- 4608 Dandelion Dr
- 4323 Churn Crk Rd
- 4648 Dandelion Dr
- 1513 Harpole Rd
- 99999 Churn Creek Rd
- 4733 Fiddleneck Dr
- 1354 Harpole Rd
- 751 Woodacre Dr
- 5142 Huntington Dr
- 5521 Churn Creek Rd
- 4646 Alta Camino Dr
- 607 Woodacre Dr
- 2366 Templeton Dr
- 3528 Silverwood St
- 1437 Murieta Loop
- 1461 Murieta Loop
- 1431 Murieta Loop
- 1473 Murietta Loop
- 1473 Murieta Loop
- Lot #3 Murieta Loop
- 0 Murieta Loop
- 1416 Murieta Loop
- 1454 Murieta Loop
- 1427 Murieta Loop
- 1485 Murieta Loop
- 1474 Murieta Loop
- 1423 Murieta Loop
- 1410 Murieta Loop
- 1494 Murieta Loop
- 1419 Murieta Loop
- 4411 Starthmore Dr
- 1497 Murieta Loop
- 4389 Starthmore Dr
- 1413 Murieta Loop
Your Personal Tour Guide
Ask me questions while you tour the home.