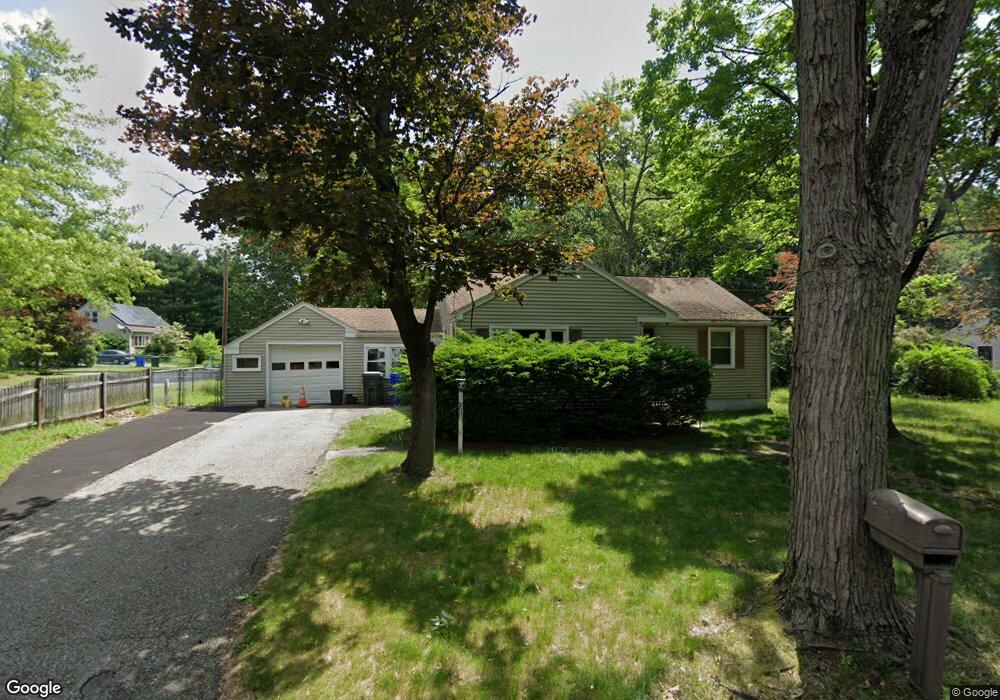
145 Stapleton Rd Springfield, MA 01109
Sixteen Acres NeighborhoodEstimated Value: $266,000 - $302,878
3
Beds
1
Bath
966
Sq Ft
$298/Sq Ft
Est. Value
About This Home
This home is located at 145 Stapleton Rd, Springfield, MA 01109 and is currently estimated at $287,970, approximately $298 per square foot. 145 Stapleton Rd is a home located in Hampden County with nearby schools including Frank H. Freedman School, John J Duggan Middle, and Springfield High School of Science and Technology.
Ownership History
Date
Name
Owned For
Owner Type
Purchase Details
Closed on
Aug 20, 1993
Sold by
Petro Stephen W and Hunt Leona
Bought by
Mars Kevin G and Mars Carolyn M
Current Estimated Value
Home Financials for this Owner
Home Financials are based on the most recent Mortgage that was taken out on this home.
Original Mortgage
$63,000
Interest Rate
7.11%
Mortgage Type
Purchase Money Mortgage
Create a Home Valuation Report for This Property
The Home Valuation Report is an in-depth analysis detailing your home's value as well as a comparison with similar homes in the area
Home Values in the Area
Average Home Value in this Area
Purchase History
| Date | Buyer | Sale Price | Title Company |
|---|---|---|---|
| Mars Kevin G | $70,000 | -- |
Source: Public Records
Mortgage History
| Date | Status | Borrower | Loan Amount |
|---|---|---|---|
| Closed | Mars Kevin G | $63,000 |
Source: Public Records
Tax History
| Year | Tax Paid | Tax Assessment Tax Assessment Total Assessment is a certain percentage of the fair market value that is determined by local assessors to be the total taxable value of land and additions on the property. | Land | Improvement |
|---|---|---|---|---|
| 2025 | $4,045 | $258,000 | $63,300 | $194,700 |
| 2024 | $3,838 | $239,000 | $63,300 | $175,700 |
| 2023 | $3,391 | $198,900 | $60,300 | $138,600 |
| 2022 | $3,595 | $191,000 | $60,300 | $130,700 |
| 2021 | $3,207 | $169,700 | $54,800 | $114,900 |
| 2020 | $3,099 | $158,700 | $54,800 | $103,900 |
| 2019 | $2,962 | $150,500 | $54,800 | $95,700 |
| 2018 | $2,860 | $145,300 | $54,800 | $90,500 |
| 2017 | $2,805 | $142,700 | $59,800 | $82,900 |
| 2016 | $2,752 | $140,000 | $59,800 | $80,200 |
| 2015 | $2,712 | $137,900 | $59,800 | $78,100 |
Source: Public Records
Map
Nearby Homes
Your Personal Tour Guide
Ask me questions while you tour the home.