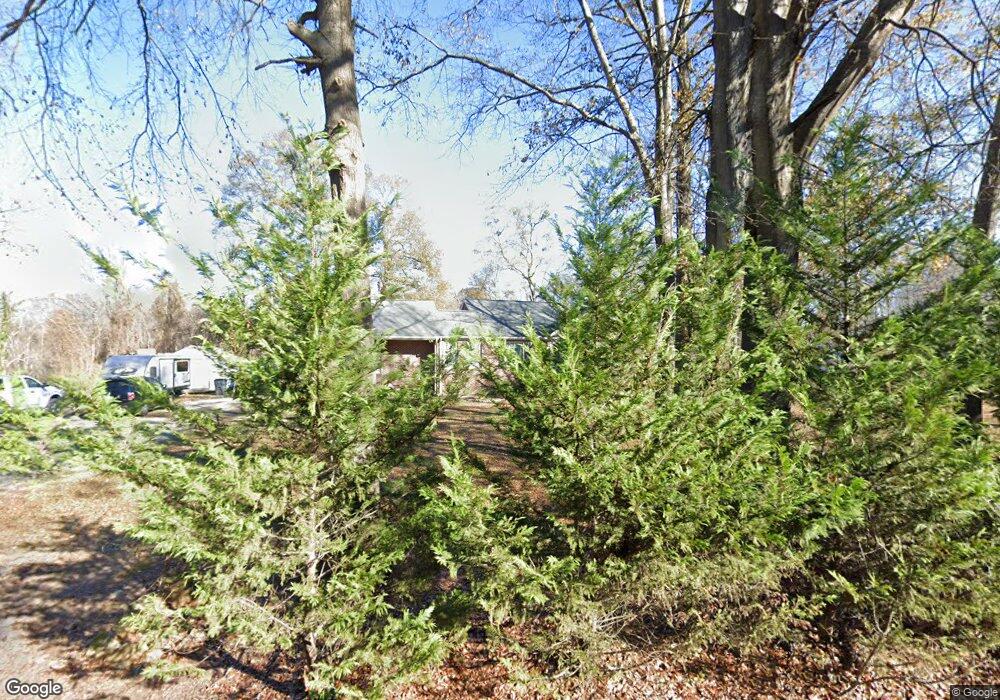
145 W Pine St Duncan, SC 29334
Estimated Value: $225,000 - $436,905
3
Beds
2
Baths
1,630
Sq Ft
$182/Sq Ft
Est. Value
About This Home
This home is located at 145 W Pine St, Duncan, SC 29334 and is currently estimated at $296,976, approximately $182 per square foot. 145 W Pine St is a home located in Spartanburg County with nearby schools including Duncan Elementary School, Byrnes Freshman Academy, and Beech Springs Intermediate School.
Ownership History
Date
Name
Owned For
Owner Type
Purchase Details
Closed on
May 20, 2011
Sold by
Federal National Mortgage Association
Bought by
Whitlock Robert
Current Estimated Value
Home Financials for this Owner
Home Financials are based on the most recent Mortgage that was taken out on this home.
Original Mortgage
$87,913
Interest Rate
4.79%
Mortgage Type
FHA
Purchase Details
Closed on
Apr 27, 2010
Sold by
Paschal Mark S and Paschal Robin E
Bought by
Federal National Mortgage Association
Purchase Details
Closed on
May 16, 2007
Sold by
Young Andy
Bought by
Paschal Mark S
Home Financials for this Owner
Home Financials are based on the most recent Mortgage that was taken out on this home.
Original Mortgage
$160,114
Interest Rate
6.12%
Mortgage Type
FHA
Create a Home Valuation Report for This Property
The Home Valuation Report is an in-depth analysis detailing your home's value as well as a comparison with similar homes in the area
Home Values in the Area
Average Home Value in this Area
Purchase History
| Date | Buyer | Sale Price | Title Company |
|---|---|---|---|
| Whitlock Robert | $90,200 | -- | |
| Federal National Mortgage Association | $190,000 | -- | |
| Paschal Mark S | $57,800 | None Available |
Source: Public Records
Mortgage History
| Date | Status | Borrower | Loan Amount |
|---|---|---|---|
| Previous Owner | Whitlock Robert | $87,913 | |
| Previous Owner | Paschal Mark S | $160,114 |
Source: Public Records
Tax History
| Year | Tax Paid | Tax Assessment Tax Assessment Total Assessment is a certain percentage of the fair market value that is determined by local assessors to be the total taxable value of land and additions on the property. | Land | Improvement |
|---|---|---|---|---|
| 2025 | $2,619 | $7,409 | $513 | $6,896 |
| 2024 | $2,619 | $9,619 | $4,302 | $5,317 |
| 2023 | $2,619 | $9,619 | $4,302 | $5,317 |
| 2022 | $2,364 | $8,353 | $3,690 | $4,663 |
| 2021 | $2,344 | $8,353 | $3,690 | $4,663 |
| 2020 | $2,319 | $8,353 | $3,690 | $4,663 |
| 2019 | $2,303 | $8,353 | $3,690 | $4,663 |
| 2018 | $2,206 | $8,353 | $3,690 | $4,663 |
| 2017 | $1,976 | $7,274 | $3,258 | $4,016 |
| 2016 | $1,922 | $7,274 | $3,258 | $4,016 |
| 2015 | $1,890 | $7,274 | $3,258 | $4,016 |
| 2014 | $1,881 | $7,274 | $3,258 | $4,016 |
Source: Public Records
Map
Nearby Homes
- 179 Rosewood Cir
- 6 S Main St Unit Ext
- 3 Elm St
- 100 Holly Dr
- 279 Finch Rd
- 1117 Syrah Ln
- 1212 N Pinot Rd
- 1321 S Pinot Rd
- 1313 S Pinot Rd
- 1325 S Pinot Rd
- 290 Forest Lake Rd
- 296 Forest Lake Rd
- 987 Echo Ridge Dr
- 000 Wingo Rd
- 0 S Danzler Rd Unit 7362340
- 128 Lyman Ave
- 124 Lyman Ave
- 120 Lyman Ave
- 102 Kalkora Ct
- 387 Bright Farm Rd
- 127 W Pine St
- 125 W Pine St
- 22 E Pine St
- 121 W Pine St
- 120 W Pine St
- 128 Hilly Hill Rd
- 18 E Pine St
- 119 W Pine St
- 124 Hilly Hill Rd
- 122 Hilly Hill Rd
- 1 Woodstock Rd
- 215 Rosewood Cir
- 117 W Pine St
- 16 E Pine St
- 219 Rosewood Cir
- 223 Rosewood Cir
- 120 Hilly Hill Rd
- 211 Rosewood Cir
- 227 Rosewood Cir
- 110 Rogers Rd
Your Personal Tour Guide
Ask me questions while you tour the home.