Estimated Value: $563,500
6
Beds
--
Bath
2,288
Sq Ft
$246/Sq Ft
Est. Value
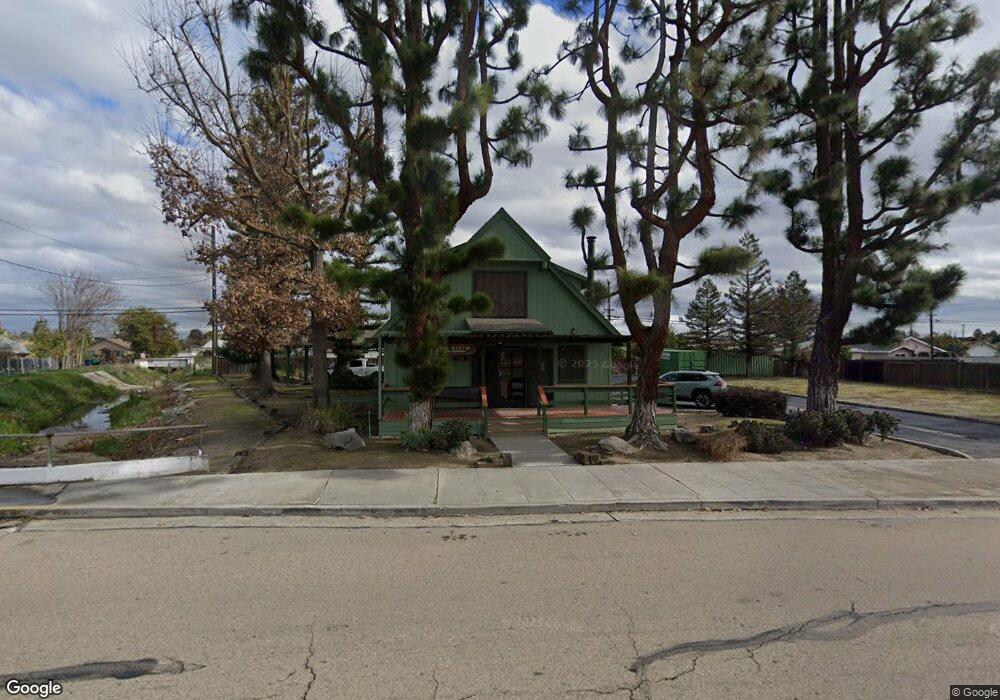
About This Home
This home is located at 1450 E Front St, Selma, CA 93662 and is currently priced at $563,500, approximately $246 per square foot. 1450 E Front St is a home located in Fresno County with nearby schools including Woodrow Wilson Elementary School, Abraham Lincoln Middle School, and Selma High School.
Ownership History
Date
Name
Owned For
Owner Type
Purchase Details
Closed on
Jan 26, 2026
Sold by
Martin John Lyle and John Lyle Martin Revocable Living Trust
Bought by
Boos Real Estate Llc
Current Estimated Value
Home Financials for this Owner
Home Financials are based on the most recent Mortgage that was taken out on this home.
Original Mortgage
$450,000
Outstanding Balance
$449,565
Interest Rate
6.15%
Mortgage Type
New Conventional
Purchase Details
Closed on
Aug 1, 2013
Sold by
Martin John L
Bought by
Martin John Lyle
Purchase Details
Closed on
Sep 22, 2006
Sold by
Saw Mill Properties Inc
Bought by
Selma Leasing Co
Purchase Details
Closed on
Sep 21, 2005
Sold by
Martin John L
Bought by
Martin John L
Home Financials for this Owner
Home Financials are based on the most recent Mortgage that was taken out on this home.
Original Mortgage
$125,000
Interest Rate
5.81%
Mortgage Type
Commercial
Purchase Details
Closed on
Mar 26, 2002
Sold by
Petery Gerald D
Bought by
Martin John L
Home Financials for this Owner
Home Financials are based on the most recent Mortgage that was taken out on this home.
Original Mortgage
$105,000
Interest Rate
6.84%
Mortgage Type
Seller Take Back
Purchase Details
Closed on
Dec 27, 2001
Sold by
Martin Susan and Martin Susan B
Bought by
Martin John L
Create a Home Valuation Report for This Property
The Home Valuation Report is an in-depth analysis detailing your home's value as well as a comparison with similar homes in the area
Home Values in the Area
Average Home Value in this Area
Purchase History
| Date | Buyer | Sale Price | Title Company |
|---|---|---|---|
| Boos Real Estate Llc | $550,000 | Old Republic Title Company | |
| Martin John Lyle | -- | None Available | |
| Selma Leasing Co | -- | Financial Title Company | |
| Martin John L | -- | Commonwealth Title | |
| Martin John L | $105,000 | Financial Title Company | |
| Martin John L | -- | Financial Title Company |
Source: Public Records
Mortgage History
| Date | Status | Borrower | Loan Amount |
|---|---|---|---|
| Open | Boos Real Estate Llc | $450,000 | |
| Previous Owner | Martin John L | $125,000 | |
| Previous Owner | Martin John L | $105,000 |
Source: Public Records
Tax History
| Year | Tax Paid | Tax Assessment Tax Assessment Total Assessment is a certain percentage of the fair market value that is determined by local assessors to be the total taxable value of land and additions on the property. | Land | Improvement |
|---|---|---|---|---|
| 2025 | $3,838 | $273,220 | $93,535 | $179,685 |
| 2023 | $3,795 | $270,783 | $89,903 | $180,880 |
| 2022 | $3,546 | $265,061 | $88,141 | $176,920 |
| 2021 | $3,520 | $264,233 | $86,413 | $177,820 |
| 2020 | $3,345 | $248,209 | $85,527 | $162,682 |
| 2019 | $3,255 | $241,621 | $83,850 | $157,771 |
| 2018 | $3,203 | $238,323 | $82,206 | $156,117 |
| 2017 | $2,840 | $230,114 | $80,595 | $149,519 |
| 2016 | $2,561 | $227,391 | $79,015 | $148,376 |
| 2015 | $2,624 | $224,845 | $77,829 | $147,016 |
| 2014 | $2,569 | $219,675 | $76,305 | $143,370 |
Source: Public Records
Map
Nearby Homes
- 1361 Almond St
- 0 Rose Ave
- 2116 Sylvia St
- 2022 Bauder St
- 2772 Valley View St
- 2629 Mccall Ave
- 2226 Arrants St
- 2126 Tulare St
- 1517 Stillman St
- 2405 Country Club Ln
- 1167 Mill St
- 1233 Redwood Ln
- 2482 Country Club Ln
- 2002 Merced St
- 12623 S Mccall Ave
- 2766 Lee St
- 2221 Floral Ave
- 2510 Whitson St
- 2753 Thompson Ave
- 2561 Stillman St Unit 111
- 1447 Tucker St
- 1453 Tucker St
- 1514 E Front St
- 1433 Tucker St
- 1509 Tucker St
- 1427 Tucker St
- 1520 E Front St
- 1417 Tucker St
- 1523 Tucker St
- 1411 Tucker St
- 1442 Tucker St
- 1526 E Front St
- 1450 Tucker St
- 1464 Tucker St
- 1436 Tucker St
- 1426 Tucker St
- 1401 Tucker St
- 1538 E Front St
- 1418 Tucker St
- 1510 Tucker St
Your Personal Tour Guide
Ask me questions while you tour the home.