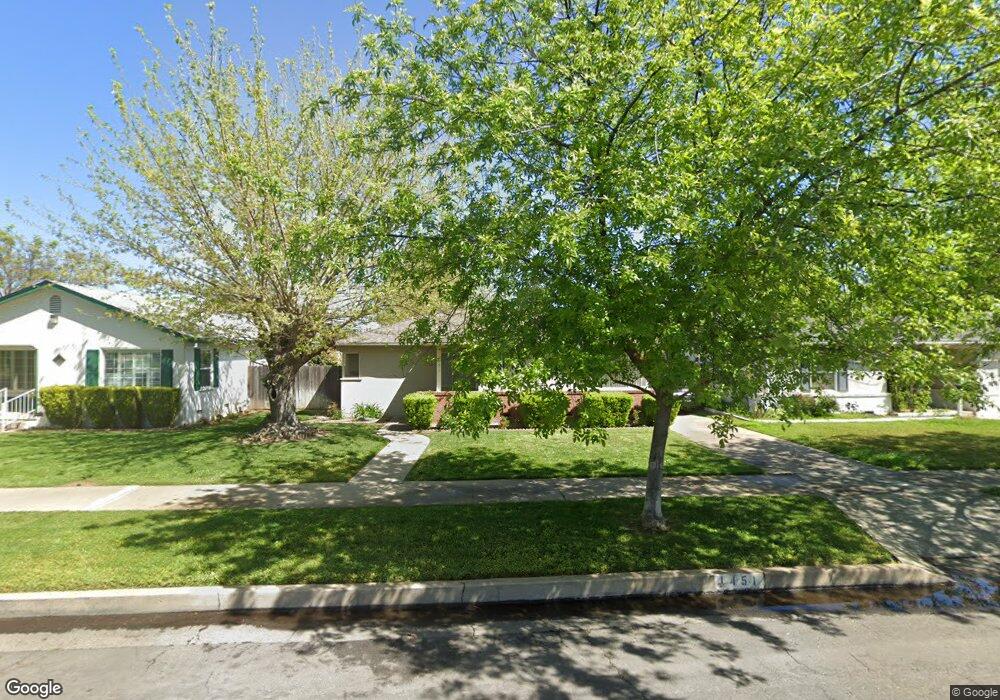
1451 W 20th St Merced, CA 95340
Downtown Merced NeighborhoodEstimated Value: $282,062 - $307,000
2
Beds
1
Bath
1,117
Sq Ft
$267/Sq Ft
Est. Value
About This Home
This home is located at 1451 W 20th St, Merced, CA 95340 and is currently estimated at $298,016, approximately $266 per square foot. 1451 W 20th St is a home located in Merced County with nearby schools including Fremont Elementary School, Tenaya Middle School, and Merced High School.
Ownership History
Date
Name
Owned For
Owner Type
Purchase Details
Closed on
Sep 22, 2010
Sold by
Federal Home Loan Mortgage Corporation
Bought by
Fradkin Chris
Current Estimated Value
Home Financials for this Owner
Home Financials are based on the most recent Mortgage that was taken out on this home.
Original Mortgage
$78,937
Interest Rate
4.18%
Mortgage Type
FHA
Purchase Details
Closed on
May 14, 2010
Sold by
Lopez Linda D
Bought by
Federal Home Loan Mortgage Corp
Purchase Details
Closed on
Mar 4, 2005
Sold by
Ekas Gordon Harry and Ekas Toni Merri
Bought by
Lopez Linda D
Home Financials for this Owner
Home Financials are based on the most recent Mortgage that was taken out on this home.
Original Mortgage
$240,350
Interest Rate
5.25%
Mortgage Type
Purchase Money Mortgage
Purchase Details
Closed on
Oct 14, 1998
Sold by
Ekas Gordon H and Ekas Toni M
Bought by
Ekas Gordon Harry and Ekas Toni Merri
Create a Home Valuation Report for This Property
The Home Valuation Report is an in-depth analysis detailing your home's value as well as a comparison with similar homes in the area
Home Values in the Area
Average Home Value in this Area
Purchase History
We collect this data history from publicly available records. To have your information removed, we recommend requesting removal directly through your county’s website.
| Date | Buyer | Sale Price | Title Company |
|---|---|---|---|
| Fradkin Chris | $80,000 | Ticor Title Riverside | |
| Federal Home Loan Mortgage Corp | $201,529 | Accommodation | |
| Lopez Linda D | $253,000 | Transcounty Title Company | |
| Ekas Gordon Harry | -- | -- |
Source: Public Records
Mortgage History
We collect this data history from publicly available records. To have your information removed, we recommend requesting removal directly through your county’s website.
| Date | Status | Borrower | Loan Amount |
|---|---|---|---|
| Previous Owner | Fradkin Chris | $78,937 | |
| Previous Owner | Lopez Linda D | $240,350 |
Source: Public Records
Tax History
| Year | Tax Paid | Tax Assessment Tax Assessment Total Assessment is a certain percentage of the fair market value that is determined by local assessors to be the total taxable value of land and additions on the property. | Land | Improvement |
|---|---|---|---|---|
| 2025 | $1,013 | $102,481 | $12,806 | $89,675 |
| 2024 | $1,013 | $100,472 | $12,555 | $87,917 |
| 2023 | $998 | $98,503 | $12,309 | $86,194 |
| 2022 | $982 | $96,572 | $12,068 | $84,504 |
| 2021 | $978 | $94,680 | $11,832 | $82,848 |
| 2020 | $983 | $93,710 | $11,711 | $81,999 |
| 2019 | $967 | $91,874 | $11,482 | $80,392 |
| 2018 | $880 | $90,073 | $11,257 | $78,816 |
| 2017 | $912 | $88,308 | $11,037 | $77,271 |
| 2016 | $896 | $86,577 | $10,821 | $75,756 |
| 2015 | $881 | $85,278 | $10,659 | $74,619 |
| 2014 | $860 | $83,609 | $10,451 | $73,158 |
Source: Public Records
Map
Nearby Homes
- 1127 W 19th St
- 2904 Dillon Ln
- 1648 W North Bear Creek Dr
- 1044 W 20th St
- 1127 W 23rd St
- 1646 W North Bear Creek Dr
- 2500 N State Highway 59 Unit 36
- 2500 N State Highway 59
- 2500 N State Highway 59 Unit 278
- 2500 N State Highway 59 Unit 239
- 2500 N State Highway 59 Unit 18
- 1664 W North Bear Creek Dr Unit 5
- 1670 W North Bear Creek Dr
- 1054 W 24th St
- 1163 W 25th St
- 1020 W 24th St
- 925 W 21st St
- 1013 W Santa fe Ave
- 902 W 20th St
- 930 W 23rd St
Your Personal Tour Guide
Ask me questions while you tour the home.