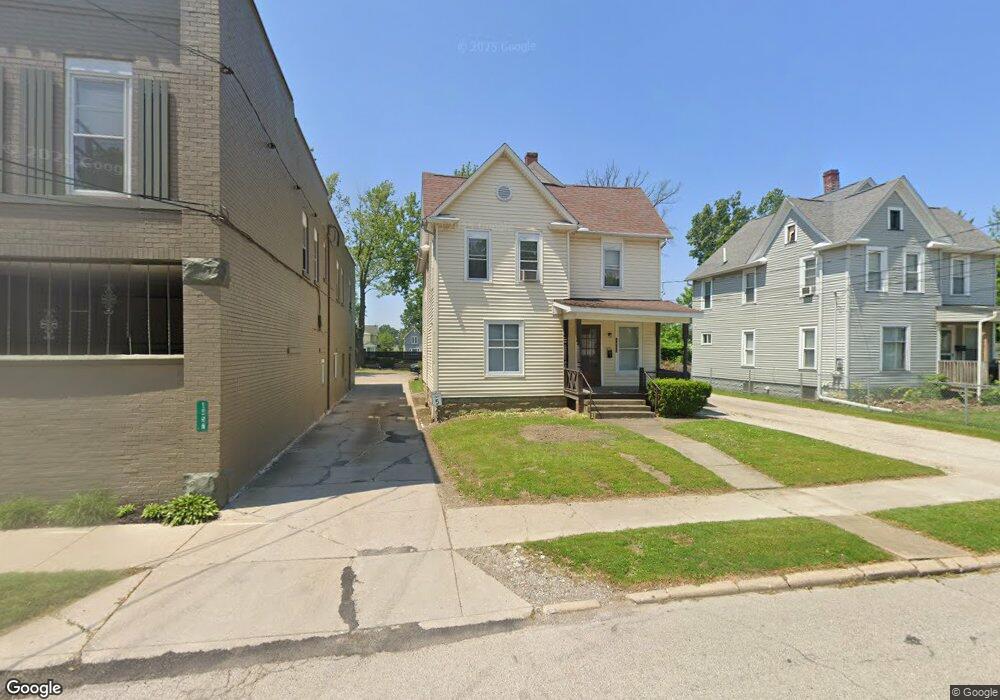
1451 W 8th St Ashtabula, OH 44004
Estimated Value: $363,000 - $494,000
4
Beds
2
Baths
1,600
Sq Ft
$276/Sq Ft
Est. Value
About This Home
This home is located at 1451 W 8th St, Ashtabula, OH 44004 and is currently estimated at $441,695, approximately $276 per square foot. 1451 W 8th St is a home located in Ashtabula County with nearby schools including Lakeside High School and Christian Faith Academy.
Ownership History
Date
Name
Owned For
Owner Type
Purchase Details
Closed on
Nov 11, 2025
Sold by
Kaico Properties Ltd
Bought by
Maroon Mountain 894 E 210 Llc
Current Estimated Value
Home Financials for this Owner
Home Financials are based on the most recent Mortgage that was taken out on this home.
Original Mortgage
$355,000
Outstanding Balance
$355,000
Interest Rate
6.34%
Mortgage Type
Credit Line Revolving
Estimated Equity
$86,695
Purchase Details
Closed on
Sep 21, 1999
Sold by
Ashtabula Holding Co Llc
Bought by
Kalco Properties Ltd
Home Financials for this Owner
Home Financials are based on the most recent Mortgage that was taken out on this home.
Original Mortgage
$60,000
Interest Rate
7.93%
Mortgage Type
New Conventional
Purchase Details
Closed on
Jul 3, 1996
Sold by
Peterson David E
Bought by
Gingleman Raymond L
Create a Home Valuation Report for This Property
The Home Valuation Report is an in-depth analysis detailing your home's value as well as a comparison with similar homes in the area
Home Values in the Area
Average Home Value in this Area
Purchase History
| Date | Buyer | Sale Price | Title Company |
|---|---|---|---|
| Maroon Mountain 894 E 210 Llc | $440,000 | Emerald Glen Title | |
| Kalco Properties Ltd | $40,000 | -- | |
| Gingleman Raymond L | $117,500 | -- |
Source: Public Records
Mortgage History
| Date | Status | Borrower | Loan Amount |
|---|---|---|---|
| Open | Maroon Mountain 894 E 210 Llc | $355,000 | |
| Previous Owner | Kalco Properties Ltd | $60,000 |
Source: Public Records
Tax History
| Year | Tax Paid | Tax Assessment Tax Assessment Total Assessment is a certain percentage of the fair market value that is determined by local assessors to be the total taxable value of land and additions on the property. | Land | Improvement |
|---|---|---|---|---|
| 2024 | $2,531 | $28,630 | $4,550 | $24,080 |
| 2023 | $1,491 | $28,630 | $4,550 | $24,080 |
| 2022 | $1,353 | $22,750 | $3,500 | $19,250 |
| 2021 | $1,364 | $22,750 | $3,500 | $19,250 |
| 2020 | $1,384 | $22,750 | $3,500 | $19,250 |
| 2019 | $1,635 | $25,730 | $3,750 | $21,980 |
| 2018 | $1,492 | $25,730 | $3,750 | $21,980 |
| 2017 | $1,456 | $25,730 | $3,750 | $21,980 |
| 2016 | $1,461 | $24,120 | $3,500 | $20,620 |
| 2015 | $1,423 | $24,120 | $3,500 | $20,620 |
| 2014 | $1,387 | $24,120 | $3,500 | $20,620 |
| 2013 | $896 | $16,420 | $2,170 | $14,250 |
Source: Public Records
Map
Nearby Homes
Your Personal Tour Guide
Ask me questions while you tour the home.